UEBA

User and Entity Behavior Analytics for anomaly detection and insider threat identification.

The User and Entity Behaviour Analytics (UEBA) module provides an advanced approach to securing an organization’s infrastructure and personnel by leveraging machine learning algorithms. Powered by the UEBA Engine, it aggregates and processes events from devices used by employees to establish baseline behavior profiles and identify anomalies. The results of these analyses are visualized through intuitive UEBA Dashboards, enabling comprehensive monitoring and investigation of user and entity activities.

Overview

UEBA transforms raw security events into actionable behavioral intelligence, offering advanced threat detection capabilities that traditional signature-based tools cannot match. Key benefits include:

  • Advanced Threat Detection: Identifies insider threats, compromised accounts, and sophisticated attacks such as Advanced Persistent Threats (APTs), ransomware, and Distributed Denial of Service (DDoS) attacks.

  • Reduced False Positives: Machine learning-driven analysis improves detection accuracy by focusing on behavioral deviations.

  • Zero-Day Protection: Detects unknown threats through anomaly-based analysis.

  • Compliance Support: Supports regulatory requirements for user activity monitoring.

  • Operational Intelligence: Provides insights into normal user and system behavior patterns.

Latest Enhancements

  • Enhanced AI Integration: Seamless connectivity with advanced machine learning models for improved analytics.

  • Improved GUI Experience: Streamlined navigation and enhanced visualizations for better usability.

  • Advanced Correlation: Improved integration between UEBA and AI-driven findings for more accurate threat detection.

  • Performance Optimization: Enhanced processing speed and reduced resource consumption for enterprise scalability.

Topics

Overview

The User and Entity Behaviour Analytics (UEBA) module provides an advanced approach to securing an organization’s infrastructure and personnel by leveraging machine learning algorithms. Powered by the UEBA Engine, it aggregates and processes events from devices used by employees to establish baseline behavior profiles and identify anomalies. The results of these analyses are visualized through intuitive UEBA Dashboards, enabling comprehensive monitoring and investigation of user and entity activities.

UEBA transforms raw security events into actionable behavioral intelligence, offering advanced threat detection capabilities that traditional signature-based tools cannot match. Key benefits include:

  • Advanced Threat Detection: Identifies insider threats, compromised accounts, and sophisticated attacks such as Advanced Persistent Threats (APTs), ransomware, and Distributed Denial of Service (DDoS) attacks.

  • Reduced False Positives: Machine learning-driven analysis improves detection accuracy by focusing on behavioral deviations.

  • Zero-Day Protection: Detects unknown threats through anomaly-based analysis.

  • Compliance Support: Supports regulatory requirements for user activity monitoring.

  • Operational Intelligence: Provides insights into normal user and system behavior patterns.

Latest Enhancements

  • Enhanced AI Integration: Seamless connectivity with advanced machine learning models for improved analytics.

  • Improved GUI Experience: Streamlined navigation and enhanced visualizations for better usability.

  • Advanced Correlation: Improved integration between UEBA and AI-driven findings for more accurate threat detection.

  • Performance Optimization: Enhanced processing speed and reduced resource consumption for enterprise scalability.

Architecture and Events

The UEBA module is integrated into the Energylogserver SIEM platform and consists of the following components:

  • UEBA Engine: Processes and analyzes user and entity events in real time, integrating with machine learning models for behavioral analysis.

  • Data Collectors: Collects data from various sources (e.g., authentication logs, network activity), normalizes it, and forwards it to the UEBA Engine.

  • Visualization Layer: Presents behavioral analytics through interactive dashboards and investigation tools.

Data Flow

Data Sources → Data Collectors → UEBA Engine → Behavioral Analytics → Dashboards

Events

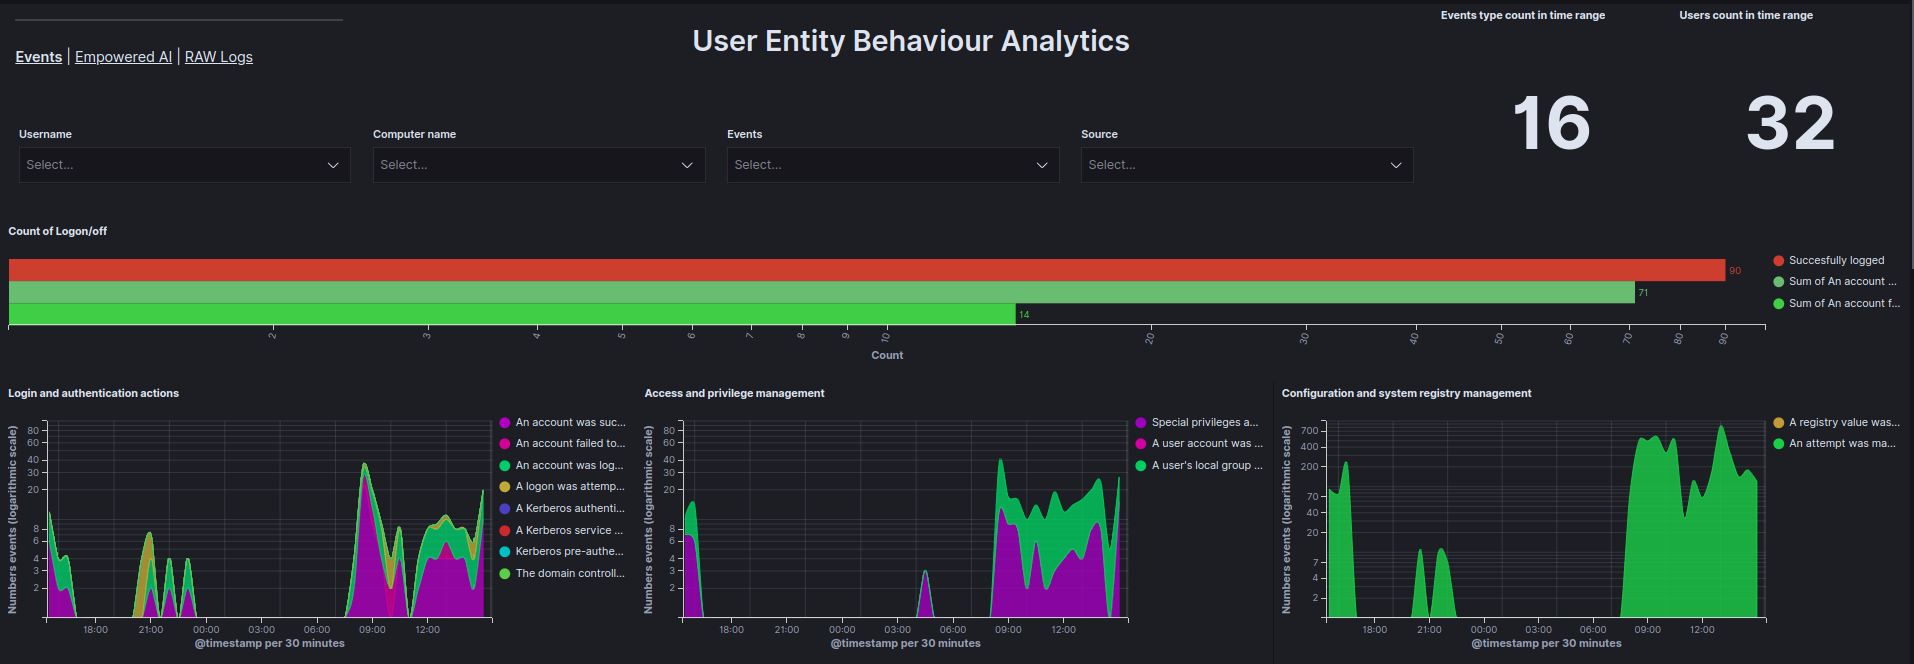
The Events tab in the UEBA Dashboard presents data received from the UEBA Engine, visualized in a clear and structured manner. Data can be filtered by User, Computer name, Event, and Source to enhance analytical accuracy.

Events tab

Data is visualized using the following graphs:

  • Count of Logon/off - Total count of Logon, Logoff, and Failed to Logon events within a specified time range.

  • Login and authentication actions - Count of login and authentication events as a function of time.

  • Access and privilege management - Count of access and privilege management events as a function of time.

  • Configuration and system registry management - Count of configuration and system registry management events as a function of time.

  • Service and process management - Count of service and process management events as a function of time.

  • Management of facilities and access to resources - Count of facility management and access-to-resource events as a function of time.

  • Account and group management - Count of account and group management events as a function of time.

  • Top 10 reported events - Ranking of the most frequently occurring events.

  • Top users by document count graph - Ranking of users generating the most documents.

  • Top 5 users by document count - Table showing the top 5 users generating the most documents.

  • Event actions - Number of actions for each event based on the user.

  • Matrix User - Computer Name - A matrix showing which users are using which devices.

Key Metrics

  • Total anomalies detected.

  • High-severity incidents.

  • Baseline deviation percentage.

Empowered AI

The Empowered AI tab provides visualizations of AI-driven analysis results, offering insights into detected anomalies and potential threats.

Empowered-AI tab

Each case is presented with the following graphs:

  • All anomalies - Displays all anomalies on a timeline.

  • (D)DoS risk - Shows the results of analyses checking whether a (D)DoS attack has occurred.

  • (D)DoS risk table - Displays the results of the analysis for each user in the Anomaly_score field and allows for the review of values for each field analyzed.

  • APT risk - Displays the results of analyses checking for potential APT attacks.

  • APT risk table - Displays the results of the analysis for each user in the Anomaly_score field and allows for the review of values for each field analyzed.

  • Ransomware risk - Displays the results of analyses checking for potential ransomware attacks.

  • Ransomware risk table - Displays the results of the analysis for each user in the Anomaly_score field and allows for the review of values for each field analyzed.

  • All events anomaly - Displays the results of analyses for all fields provided by the UEBA Engine to identify abnormal user behavior.

  • All events anomaly table - Displays the results of the analysis for each user in the Anomaly_score field and allows for the review of values for each field analyzed.

  • Service installation anomalies - Displays the results of analyses related to service installation anomalies.

  • Logon anomalies - Displays the results of analyses related to Logon, Logoff, and Failed to Logon events.

  • Affected users table - Displays the highest and average Anomaly_score for each user and the type of analysis in which that score occurred.

  • Affected users - Shows a pie chart highlighting the users most affected by anomalies.

AI-Driven Insights

  • Anomaly Detection: Highlights deviations from baseline behavior, scoring anomalies based on severity.

  • Threat Correlation: Links anomalies to known threat patterns and suggests investigation paths.

  • Predictive Analysis: Forecasts potential future threats and identifies emerging behavioral trends.

Raw Logs

The Raw Logs tab displays the basic information provided by the UEBA Engine in an organized table, enabling verification of specific events, including the time, user, and device involved.

Raw Logs tab

Log Inspection Tools

  • Raw Data View: Displays unprocessed log entries, filterable by user, entity, or timestamp.

  • Correlation Engine: Cross-references logs with behavioral baselines to identify related events and potential threats.

  • Export Capabilities: Allows exporting logs in CSV or JSON formats for external analysis, with customizable time range selection.

Configuration and Setup

Initial Setup

  1. Log in to the Energylogserver SIEM Console.

  2. Navigate to Security AnalyticsUEBAConfiguration.

  3. Set data sources (e.g., authentication logs, network activity).

  4. Define the baseline training period (default: 30 days).

  5. Save settings.

Advanced Configuration

ueba:
  engine:
    enabled: true
    data_sources:
      - "security-*"
      - "auth-*"
    training_period: "30d"
    anomaly_threshold: 2.5
  collector:
    interval: "5m"
    batch_size: 1000

Performance Tuning

  • Adjust thread pool size for optimal processing.

  • Optimize memory allocation for large-scale environments.

  • Set data retention policies to manage storage efficiently.

Behavioral Baselines

Baseline Creation

  • Automatic Baseline: Trains on an initial 30-day data period, updating dynamically every 7 days, considering user, entity, and system context.

  • Manual Baseline Adjustment:

    1. Navigate to UEBABehavioral Baselines.

    2. Select the entity or user.

    3. Adjust baseline parameters.

    4. Apply changes.

Baseline Monitoring

  • Key Indicators: Baseline stability, anomaly rate, and adaptation frequency.

  • Alerts: Notifications for baseline drift, insufficient data, or model retraining requirements.

Integration and Best Practices

  • SIEM Plan: Displays UEBA anomalies in SIEM dashboards and supports investigation workflows.

  • Alerting: Generates alerts from behavioral anomalies with integrated risk scores.

  • Visualizations: Enhances dashboards with behavioral charts and graphs.

Best Practices

  • Data Collection: Ensure comprehensive coverage of user and entity data sources while maintaining data quality.

  • Model Tuning: Regularly update baselines, adjust anomaly thresholds, and validate with real incidents.

  • User Training: Educate staff on UEBA concepts, dashboard usage, and conduct simulation exercises for effective adoption.