Management Interface
This plugin consists of two main sections - Pipelines Management and Network Probes which will be detailed below.
Note
The Management Interface communicates with each probe via the license-service API using TLS. The SSL certificates are located at /opt/license-service/ssl/ and are configured automatically during license-service installation.
Pipelines Management
This tab allows you to manage pipelines on all probes simultaneously. The list below presents a list of available pipelines that can be assigned appropriately after clicking the button on the right.
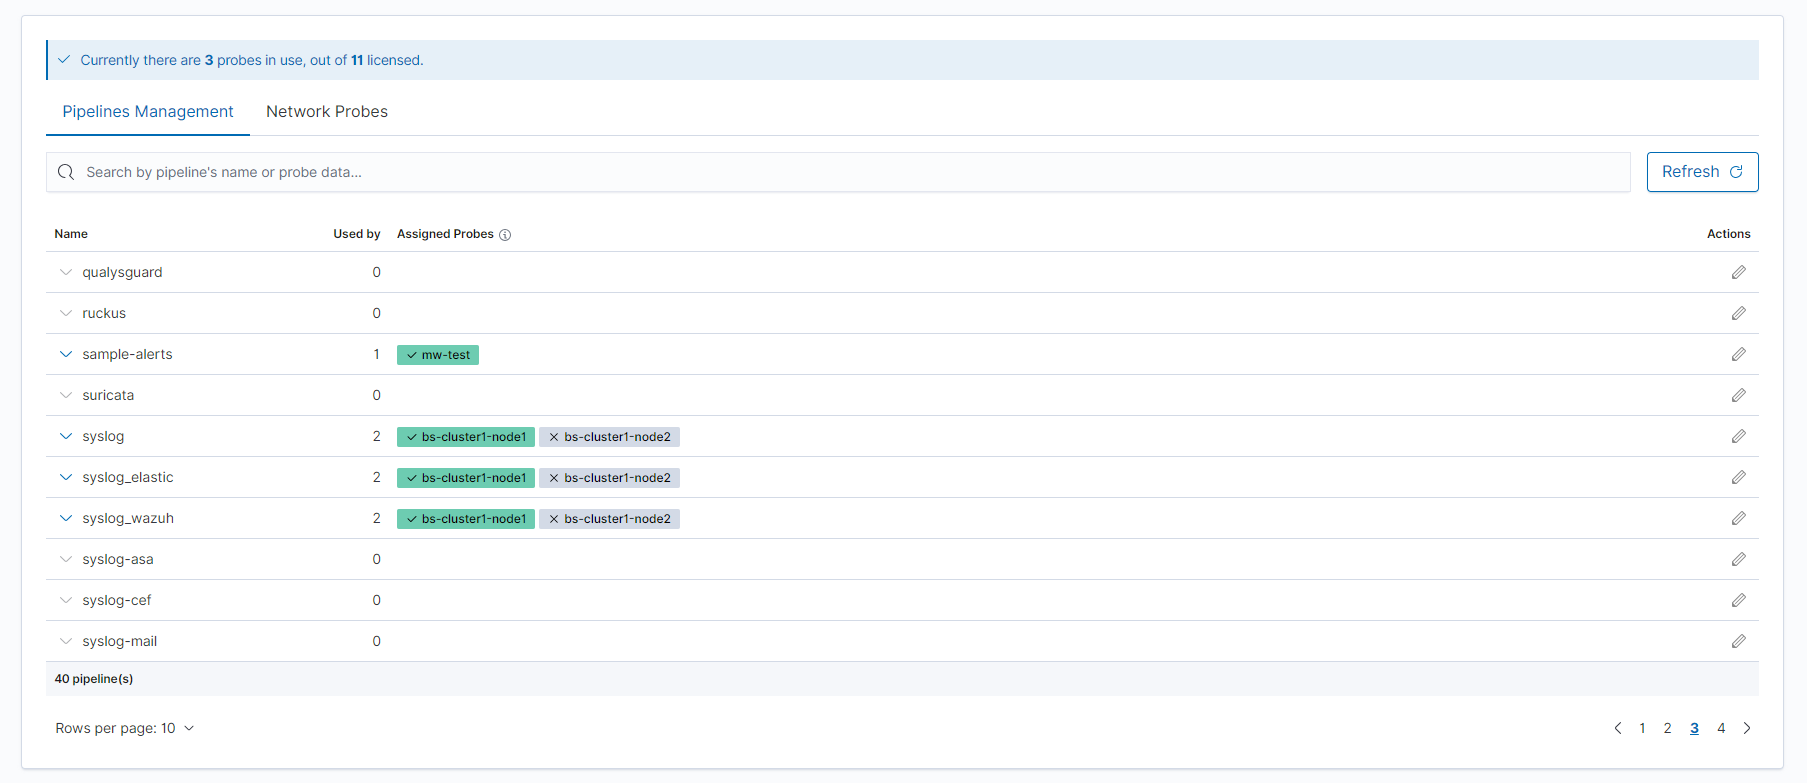
Each row of the table describes a pipeline that can be used by the probe. There we can find data such as:
name of the pipeline
information about the probes on which the pipeline runs
how many probes utilize the pipeline
The described list is searchable in two ways: the pipeline can be found by its name or the hostname of the assigned probe to it.
New Pipeline Creator
The New Pipeline Creator is a tool that allows pipeline creation to be done from the GUI.
Follow these steps to create a new pipeline:
Click the
New pipelinebutton in theNetwork Probetab.When the Pipeline Creator window pops up, enter your new pipeline name in the designated field.
Select or drag and drop the configuration files into the designated field. These files must be in the format
*.confand be no larger than 1 MB. You can select more than one file.Select where the pipeline will be enabled and ready to collect data. If the pipeline is not enabled, it will be installed, but will not be used for data ingestion.
Press the
Submitbutton to save your pipeline setup.
Pipeline Details
A green label with a check icon means that this probe is working and the pipeline is enabled. On the other hand, a gray label with a cross means that the pipeline should be working, but the probe is not responding.
Clicking on a probe in the assigned probes column redirects to the statuses of pipelines running on that specific probe.
More details of pipelines can be expanded by clicking on the arrow on the left.
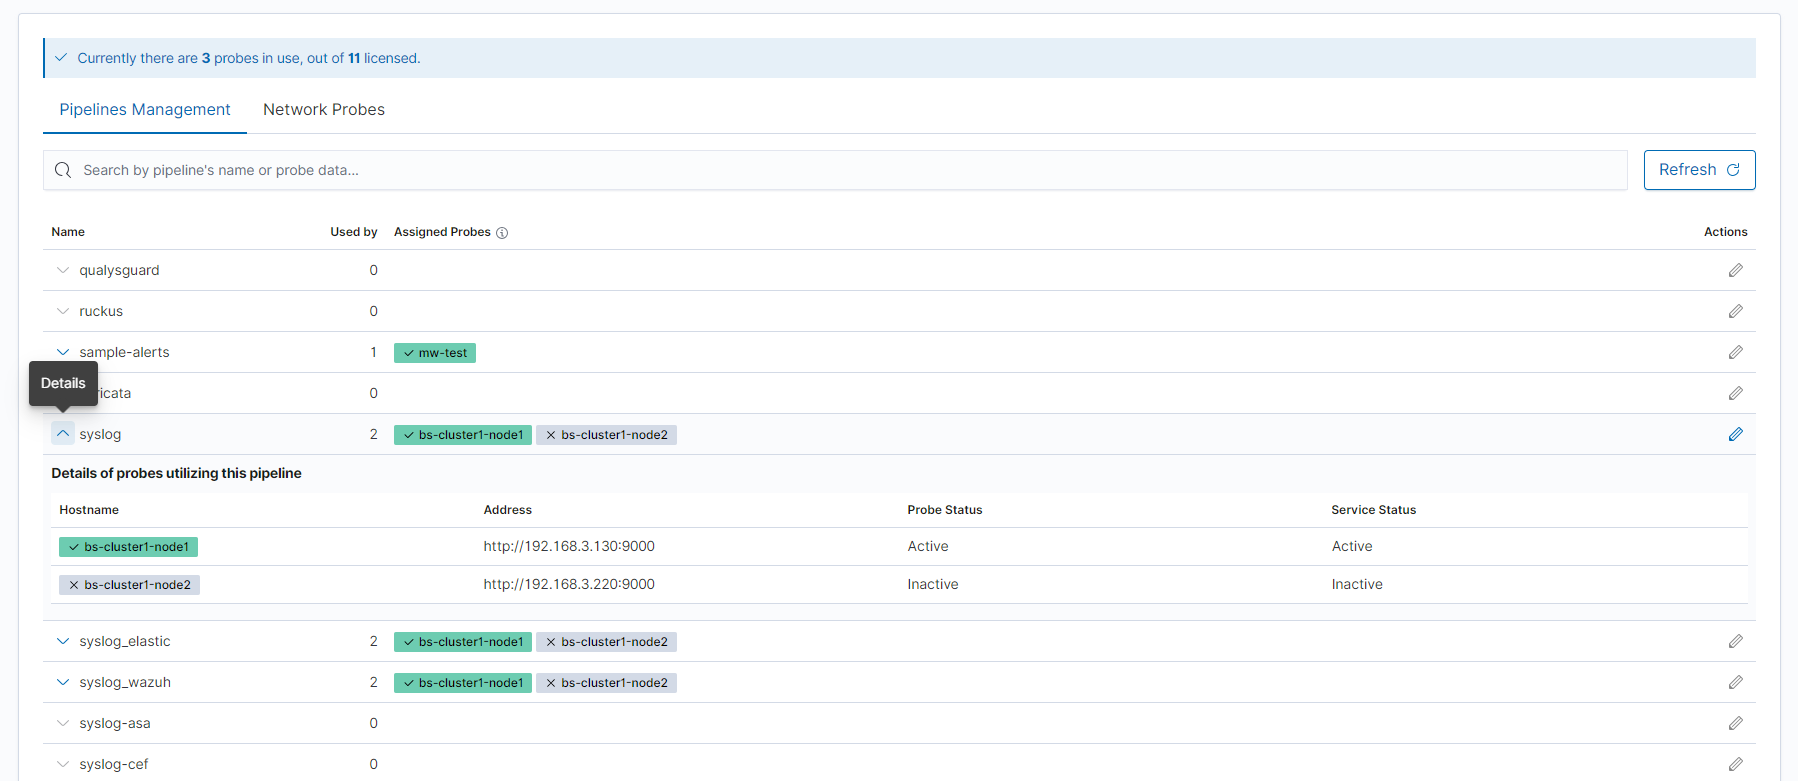
In the details, we can find data about the hostname, address, and status of the probes.
Manage pipeline
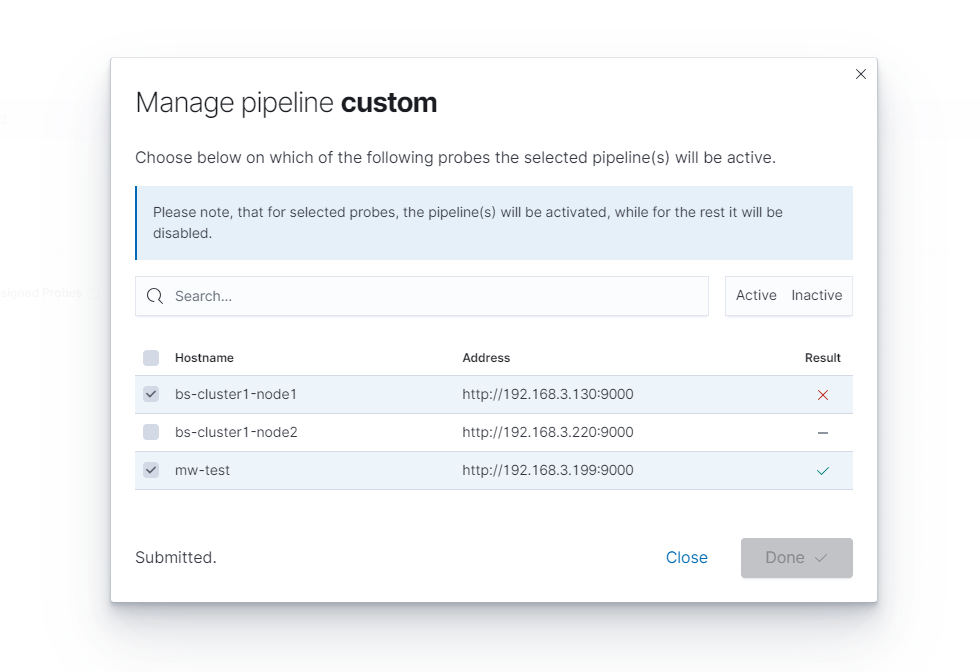
After clicking the pencil icon on the right, the following pipeline configuration window will appear.
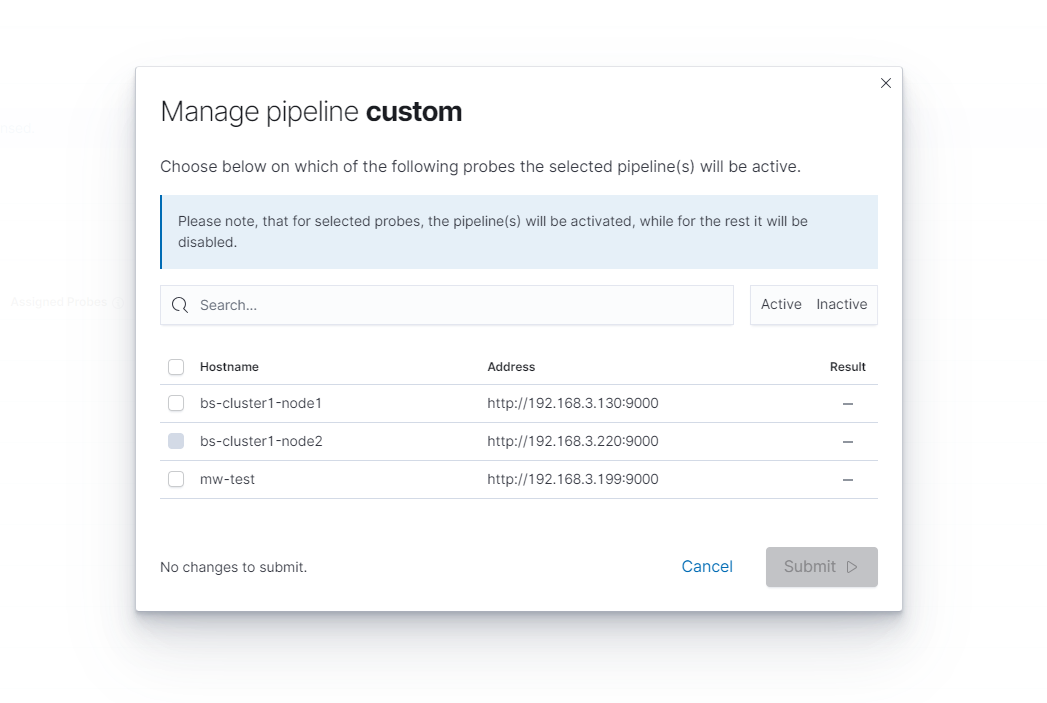
The list shows the assignment of this pipeline to available probes. If a given row is unchecked, it means that the pipeline is not assigned to this probe. Similarly, if the line is selected, the pipeline already works.
If a given probe cannot be selected, it means that the probe is not working and no changes can be made to it.
After making any changes to the table, pipelines will be highlighted and their status will change after clicking the submit button. In the lower-left corner, there is precise information about what operations will be performed.
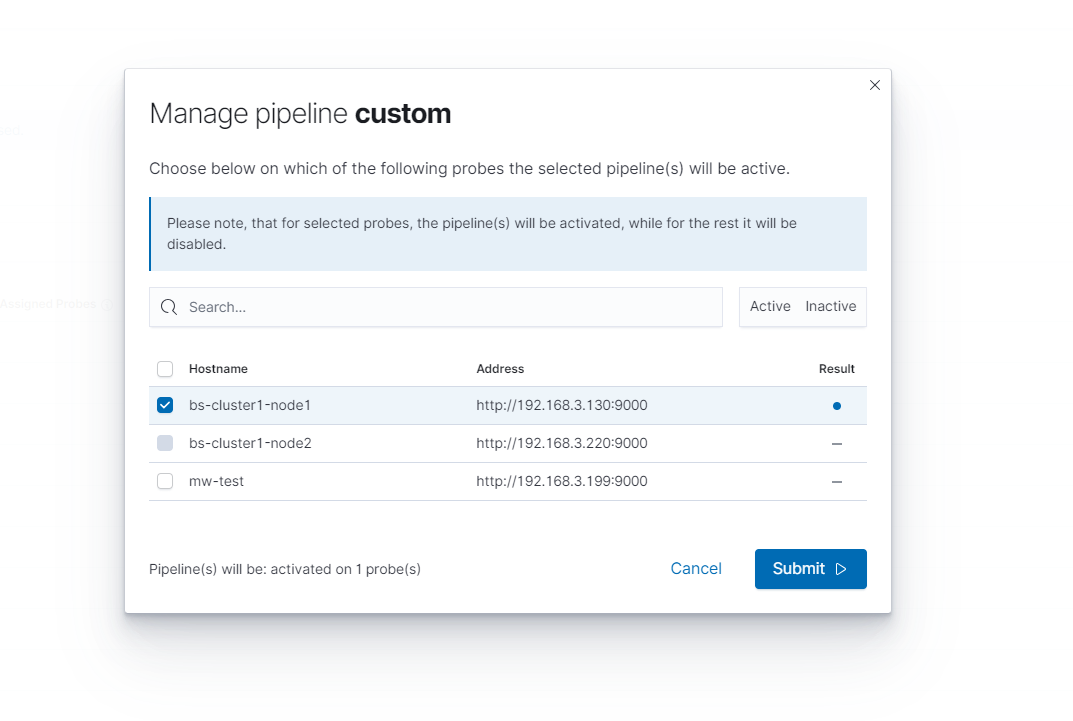
For example, the above photo shows a situation in which the custom pipeline will be activated on the first probe. In turn, no operation will be performed for the rest.
The process of activation or deactivation of the pipeline can be monitored based on the status in the Result column.
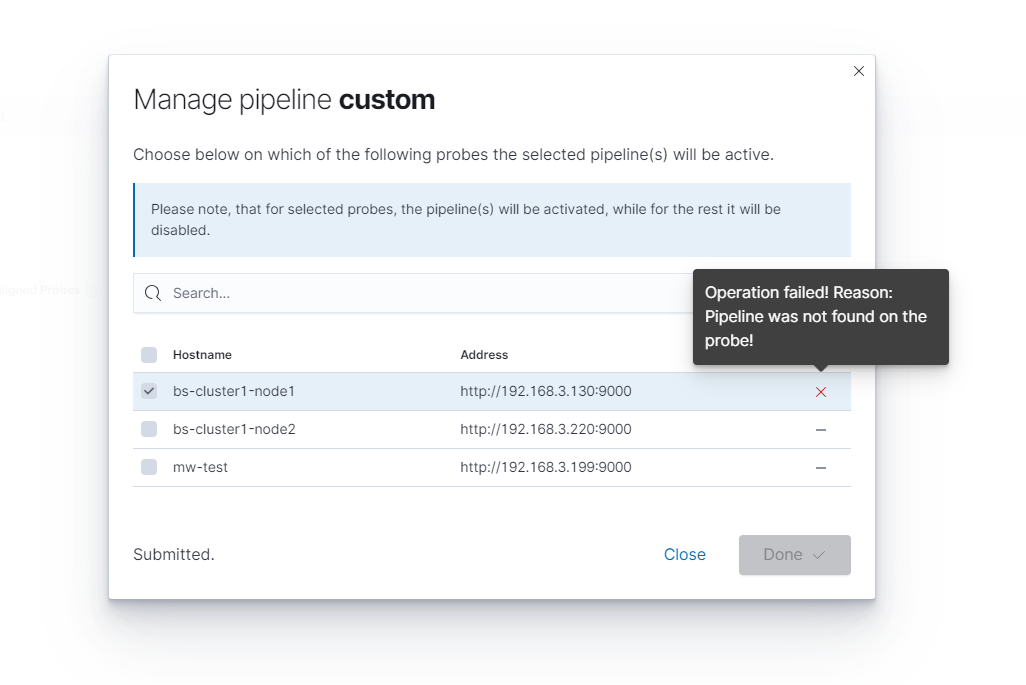
After the operation has been completed, an appropriate icon will be displayed - green if everything went well or red if something went wrong.
When you hover over the result icon, an error message can be seen, such as presented below:
Following the changes, clicking the close button, and refreshing the pipeline lists, the change should be visible.
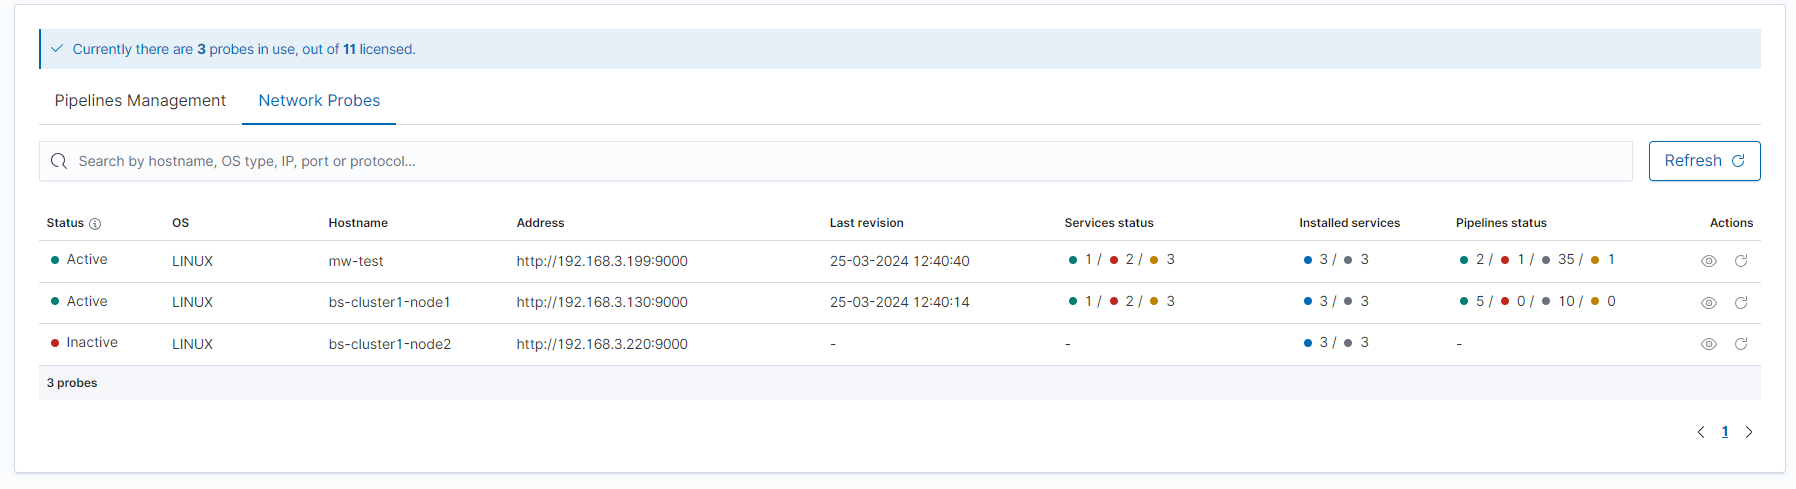
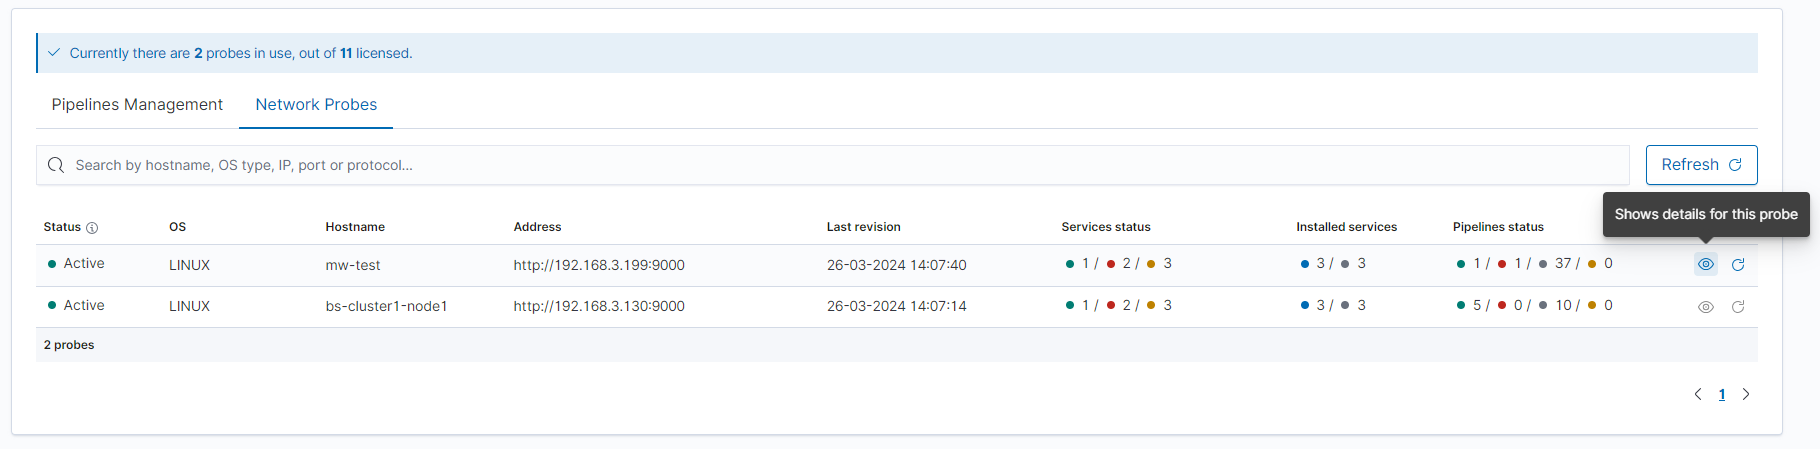
Network Probes
This tab shows all registered probes. Here you can check data, such as:
status - information on whether the probe is working
operating system
hostname
address
last revision - when the probe responded correctly last time
services status
installed services
pipelines status
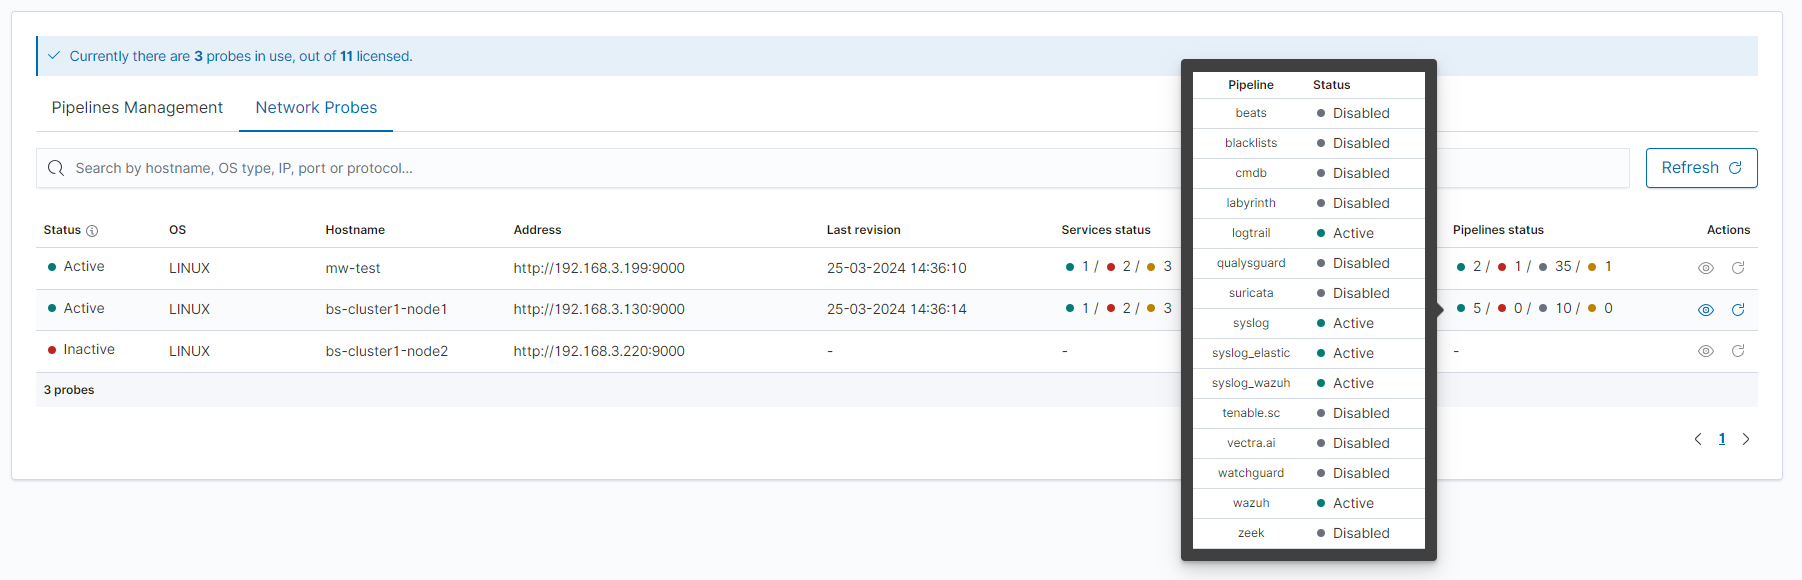
After hovering over one of the columns regarding services or pipelines, a table with more details will be displayed.
To open more details of the probe and use the ability to manage services, pipelines, or files click on the eye icon on the right, as shown below.
Services Section
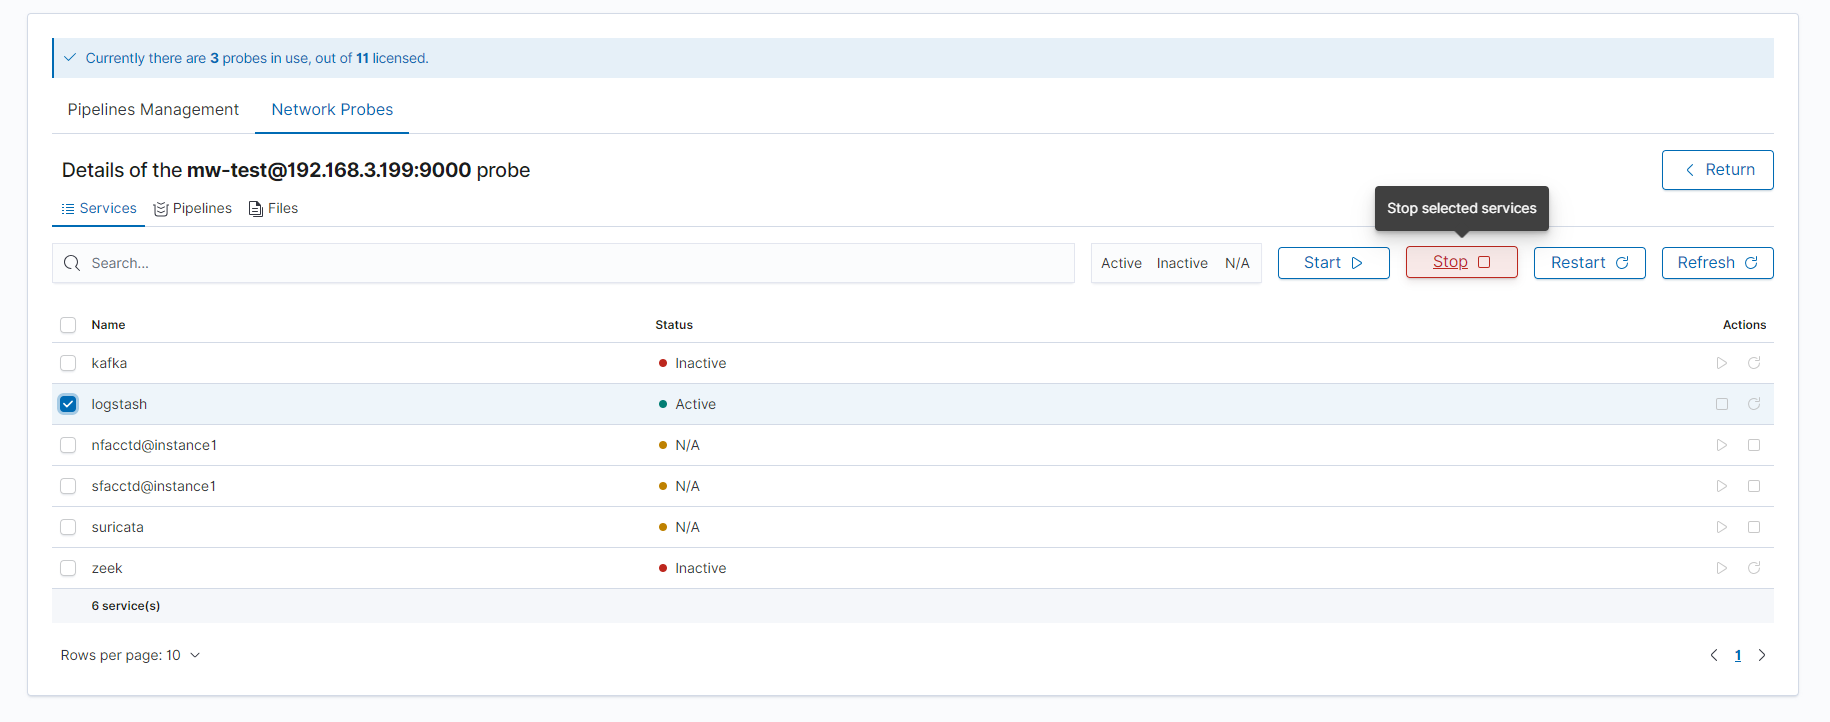
This section is used to manage defined services. Here you can view their status and, depending on the situation, enable, disable, or restart the service.
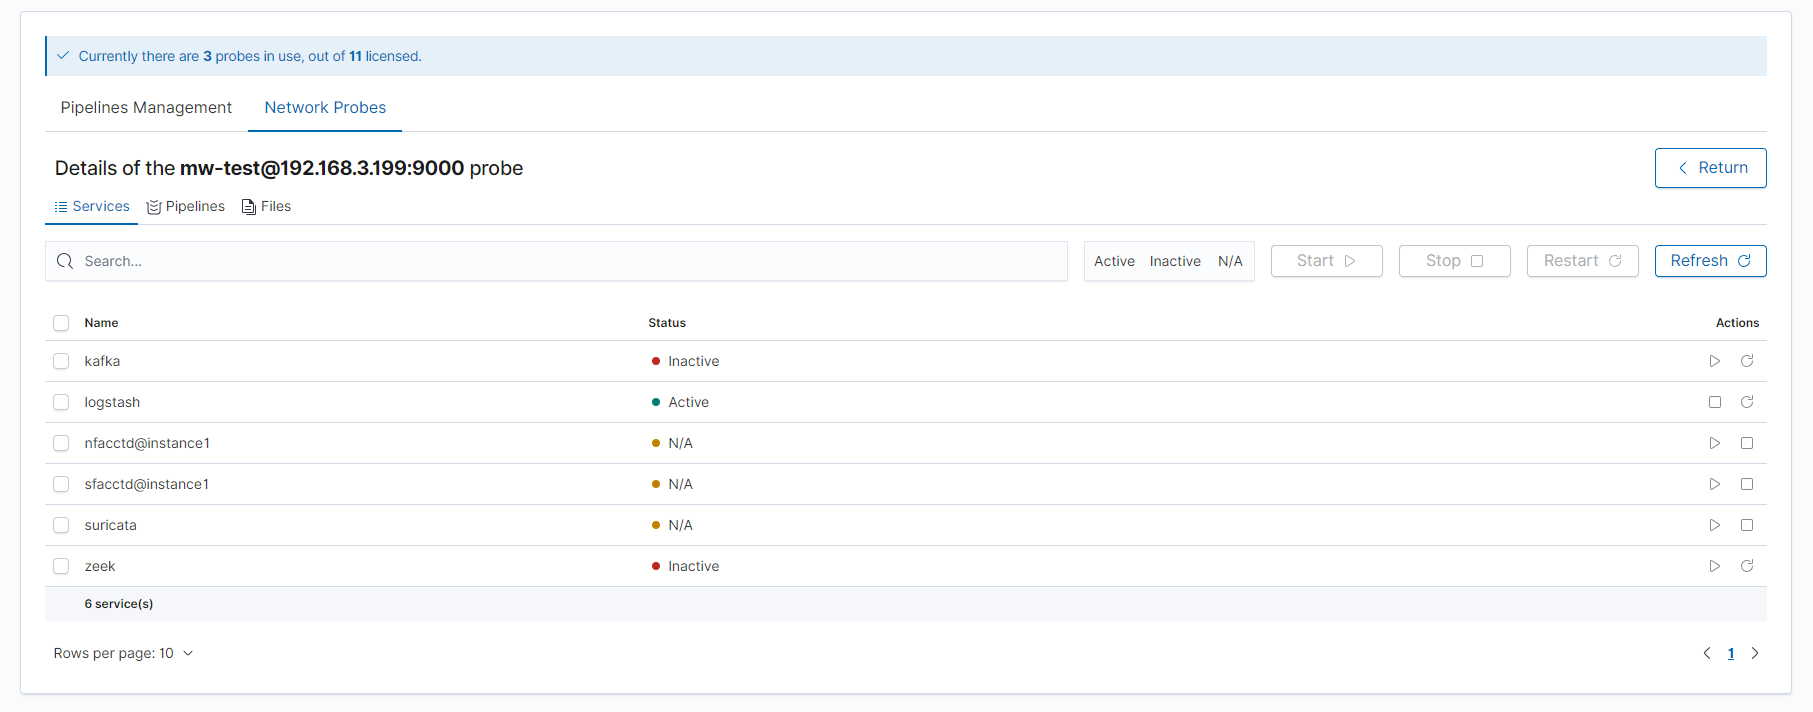
Services can be managed individually or by selecting several lines at the same time.
Pipelines Section
This section is used to manage pipelines. Here you can observe the status and statistics of pipelines to monitor their functioning. You can also enable or disable a given pipeline, as well as reload service configuration files using the reload method. All functionalities will be described below, but first some introduction to pipeline configuration definition.
Pipeline configuration
By default pipeline can be defined as a set of files consisting of:
definition file- file with name and path to configuration files directory and possibly some pipeline-specific options. Such a file can define multiple pipelines at once. The default path is:/etc/logserver-probe/pipelines.d/pipeline_name.yml.configuration files- files containing pipeline plugins configurations. By default, it is:/etc/logserver-probe/conf.d/pipeline_name/*.conf, but it can be altered through a definition file.
The above settings can be found in the pipeline details, after clicking the arrow on the left.
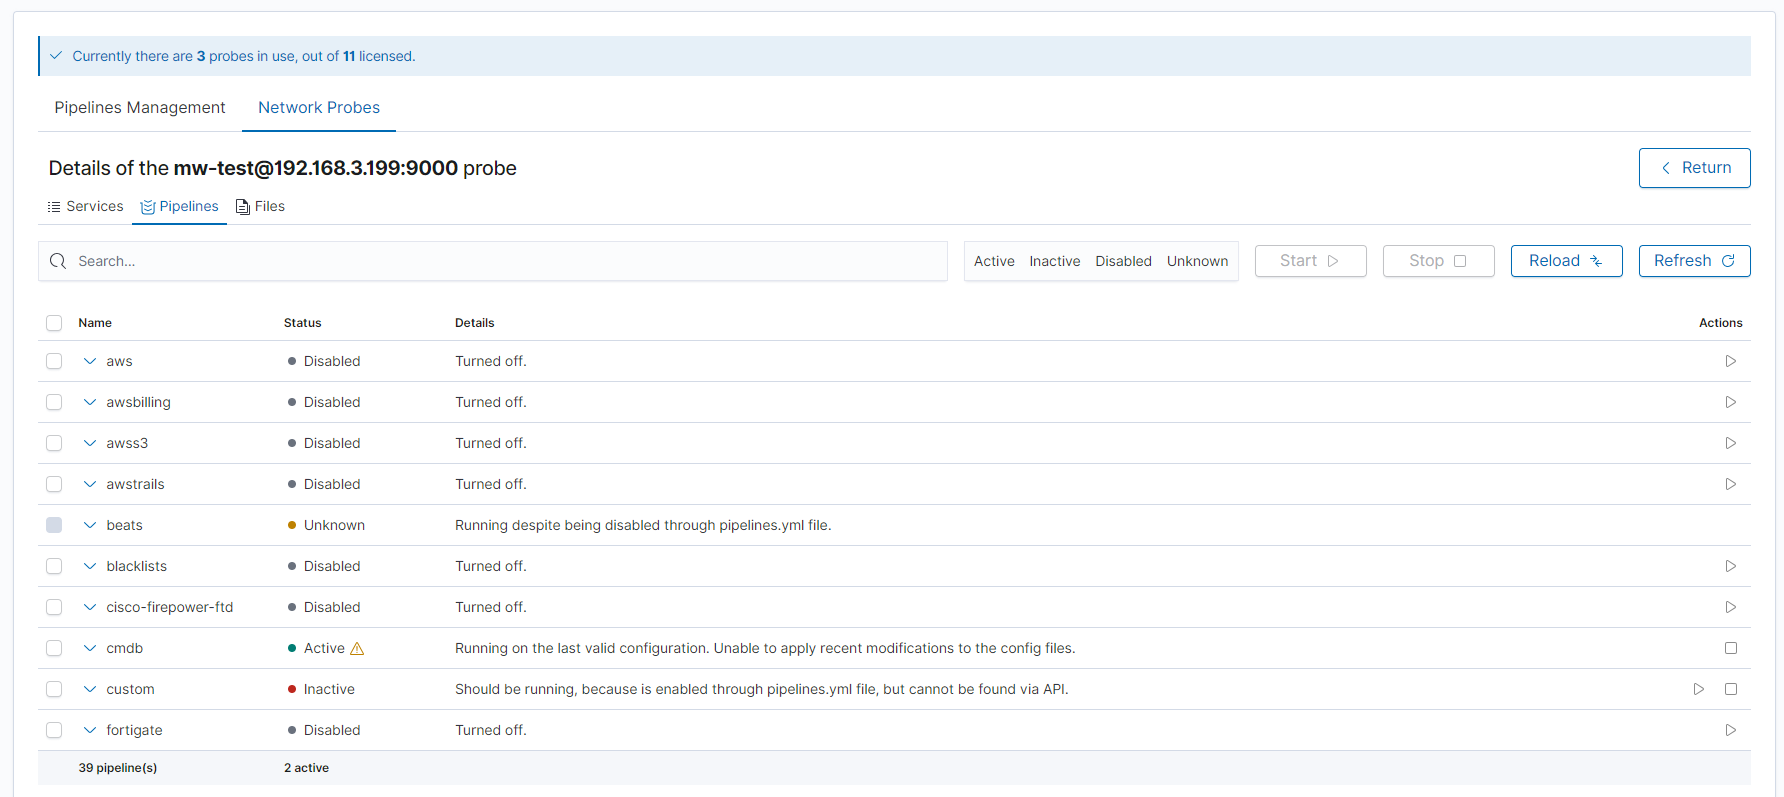
Pipeline status
Pipeline status can be one of the following:
Active - pipeline is enabled and running. Everything works as expected, and runtime statistics are available.
Active with warning - the pipeline is enabled and running, but some reload error has occurred.
Inactive - the pipeline should work because it is enabled, but it does not work and its statistics cannot be found.
Disabled - the pipeline is disabled and is not running.
Unknown - pipeline has unexpectedly failed, it covers situations such as wrong configuration, corrupted files or not working service.
In addition to the status, the adjacent column displays details that specifically describe the current status and may indicate the cause of a hypothetical error.
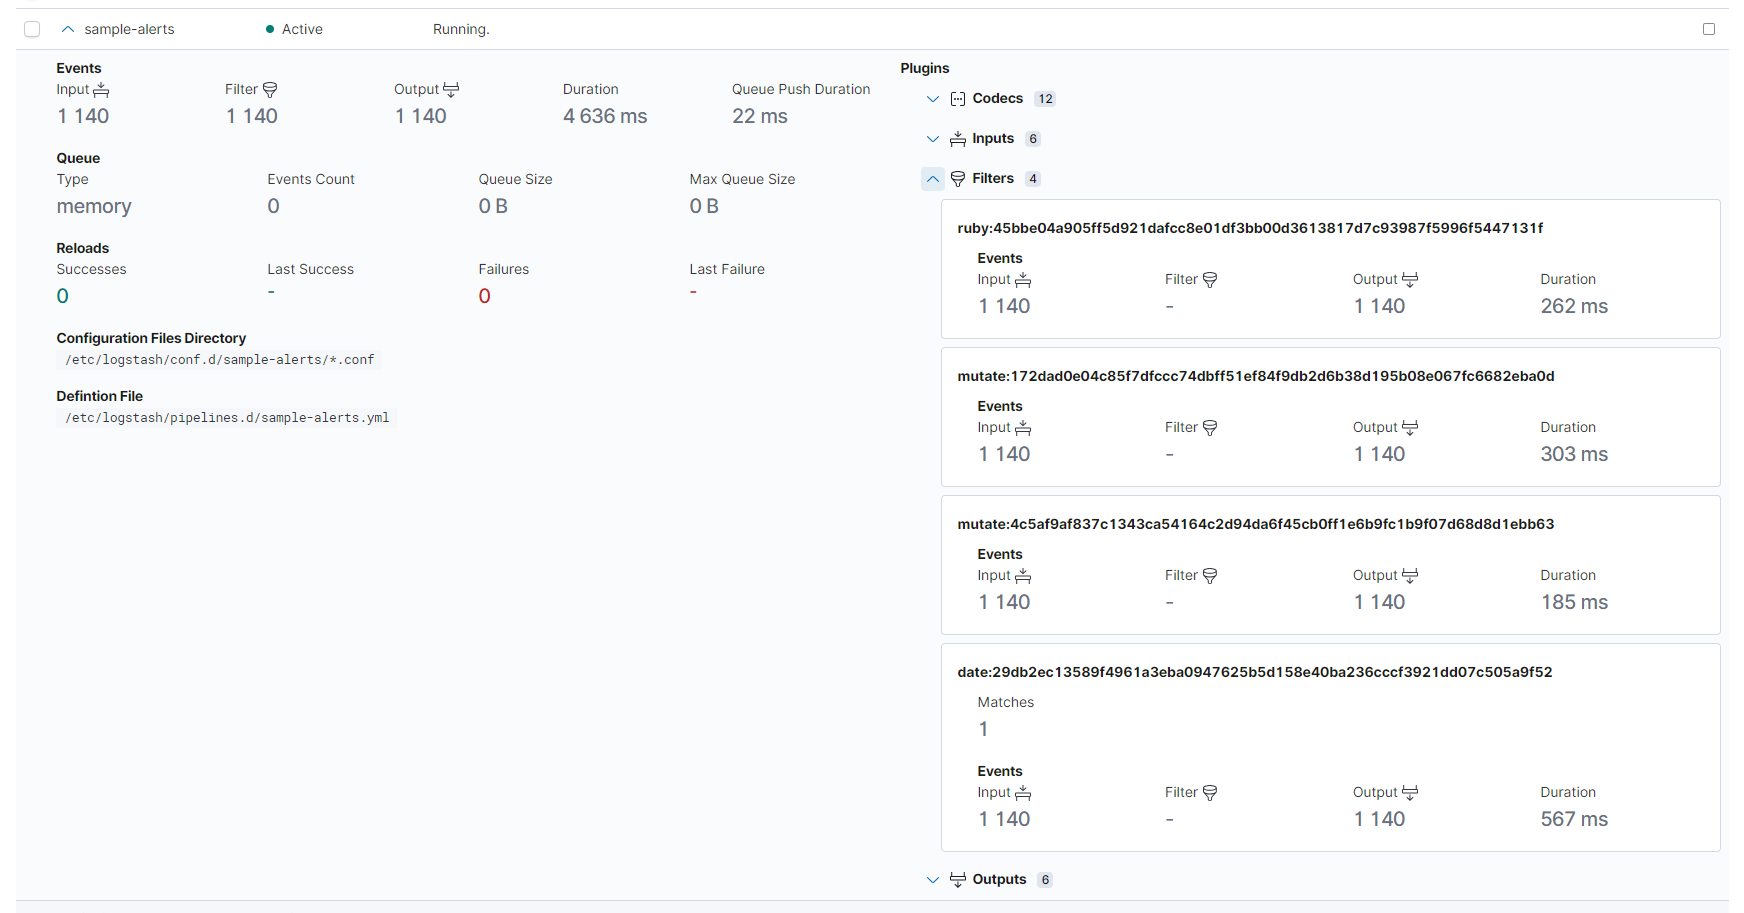
The arrow on the left can be clicked to view more details. Configuration details will be displayed for all pipelines, and for active pipelines you can view the runtime statistics such as:
input, filter, and output events
queue details
utilized plugins (input, filter, output, and codecs)
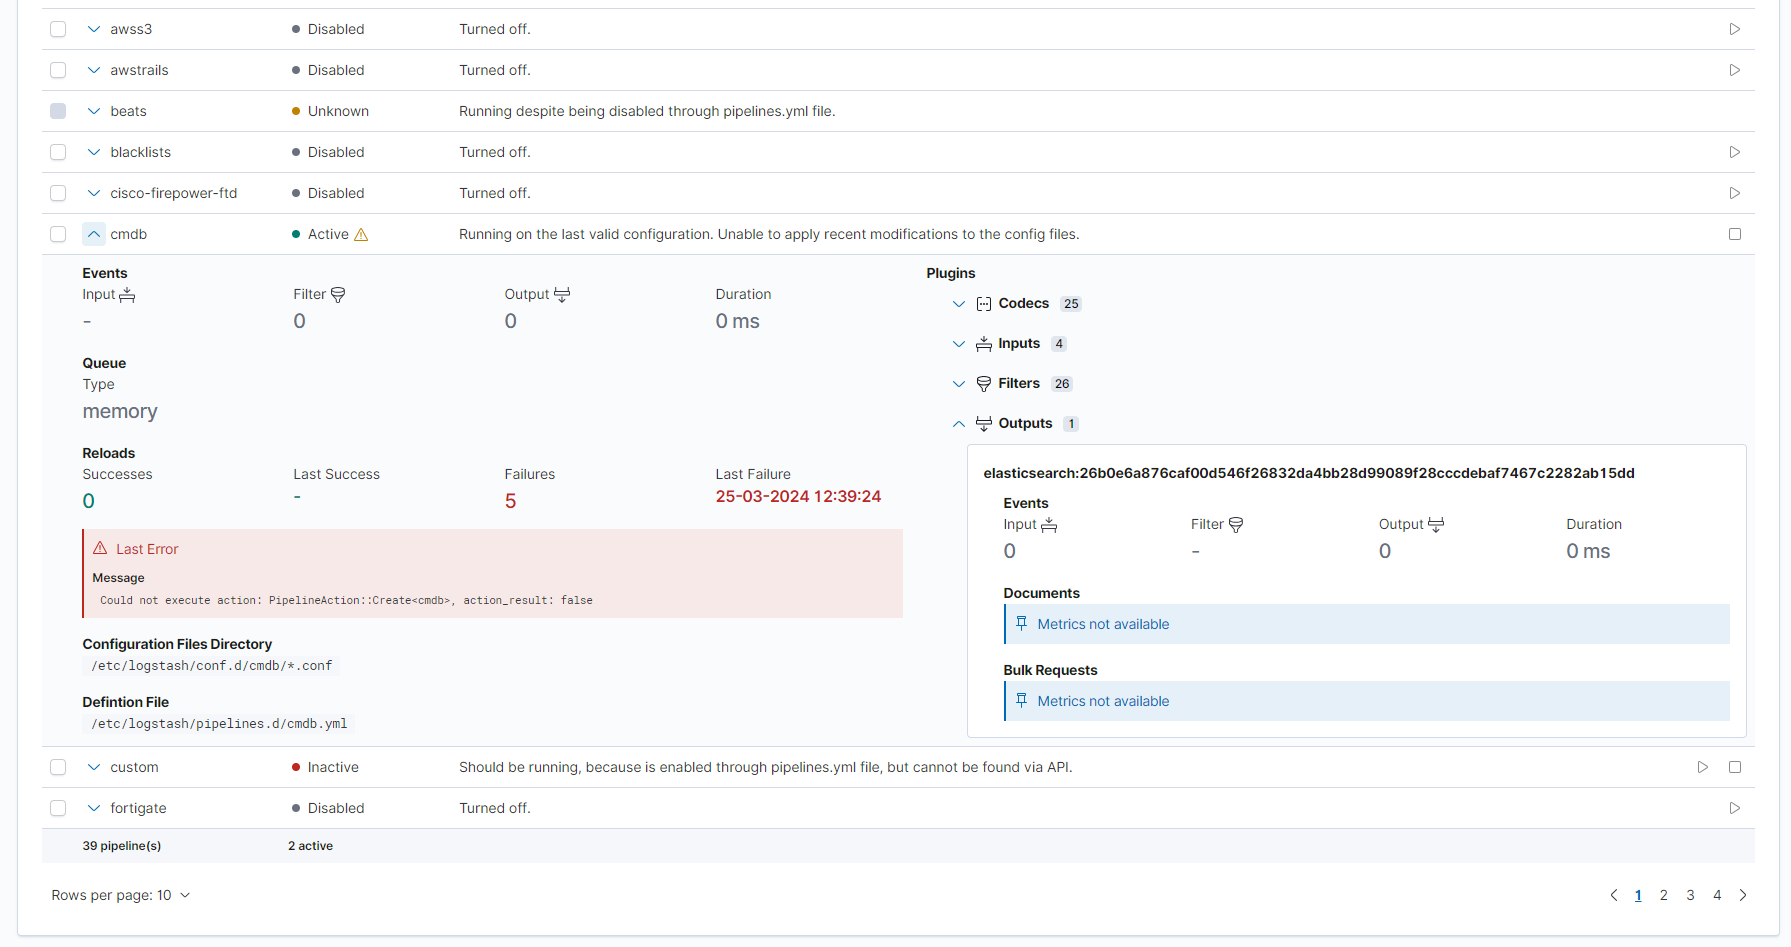
If a reload error has occurred, it will also be visible there, as shown below.
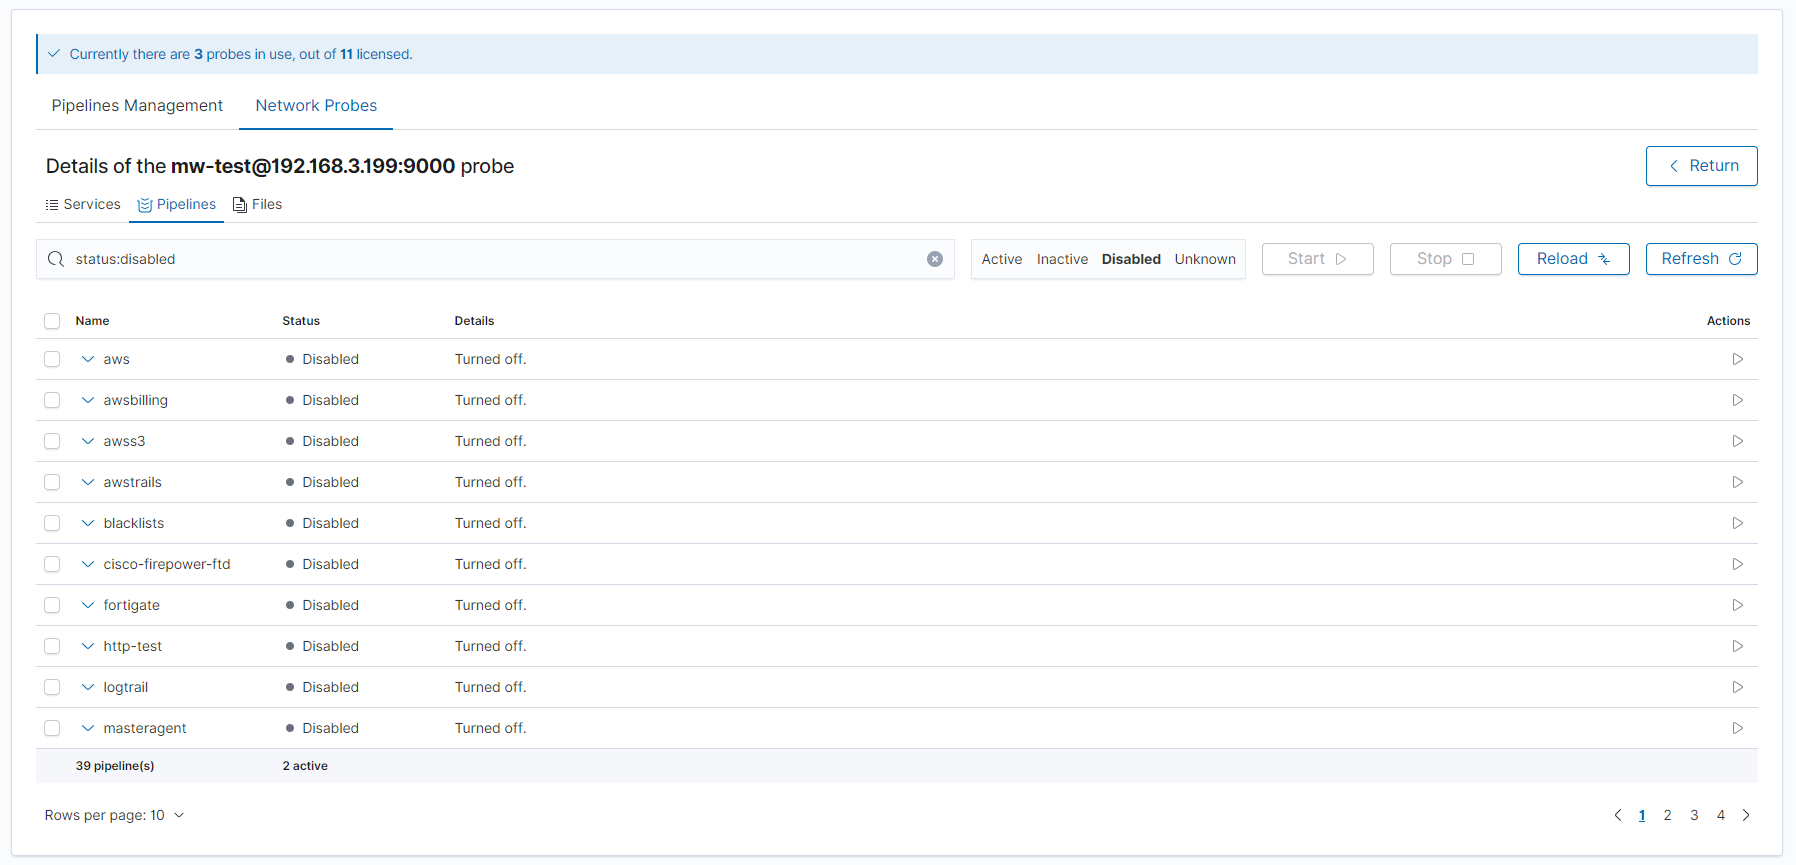
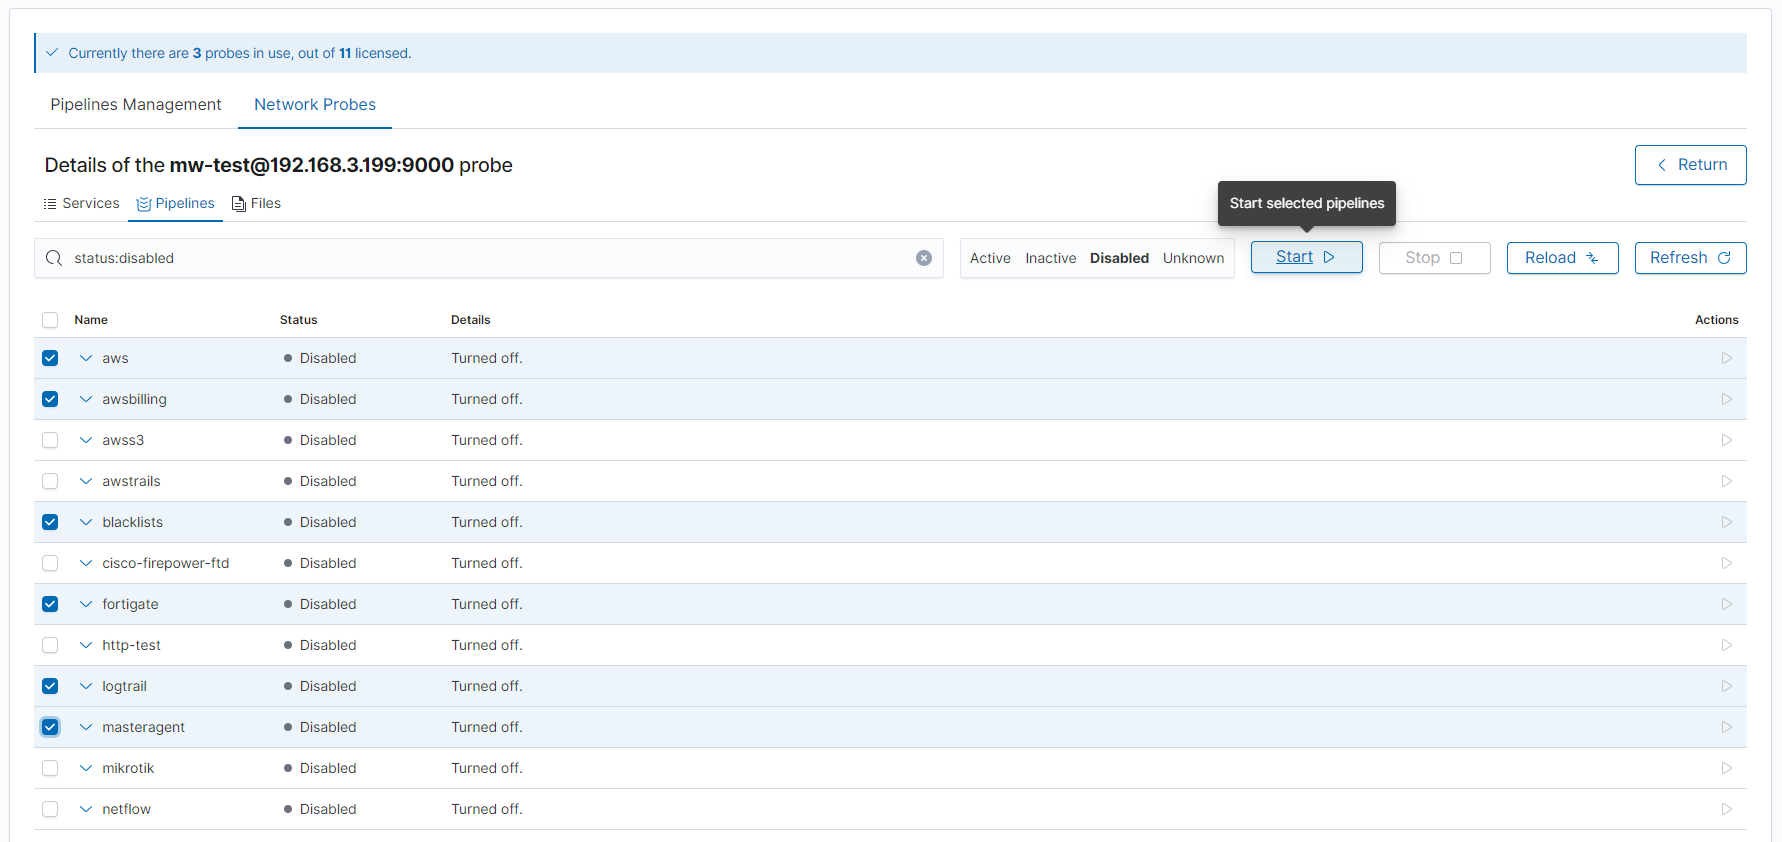
Filtering by status
The list of pipelines can be filtered based on their status using the four buttons next to the search bar. Thanks to this, only pipelines with the same status can be displayed, increasing the readability of the table. Below only disabled pipelines are shown:
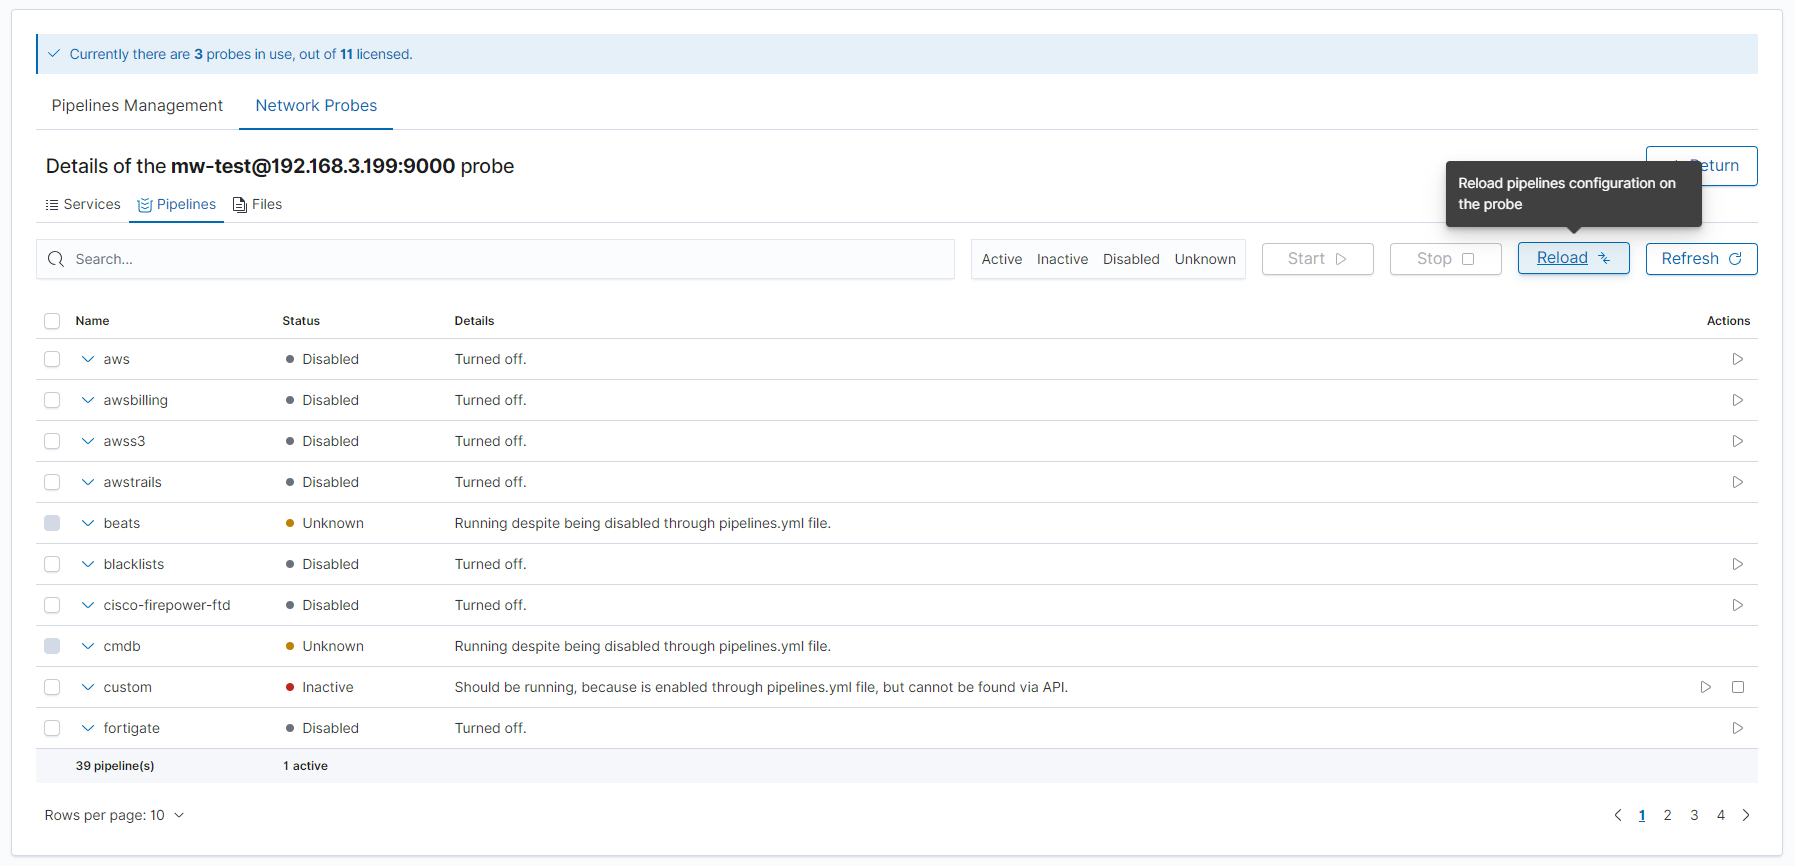
Reload pipelines configuration
The Network Probe configuration can be reloaded directly from this view, with the help of the Reload button. Any changes to the configuration files used by Network Probe will be reloaded, without the need of restarting the service itself.
In the case of enabling/disabling pipelines, this operation is performed automatically.
Enable/disable pipeline
Depending on the status of the pipeline, it can be enabled or disabled. This can be achieved either for each of them individually or using a multi-selector to select many at once (then all selected must have the same state).
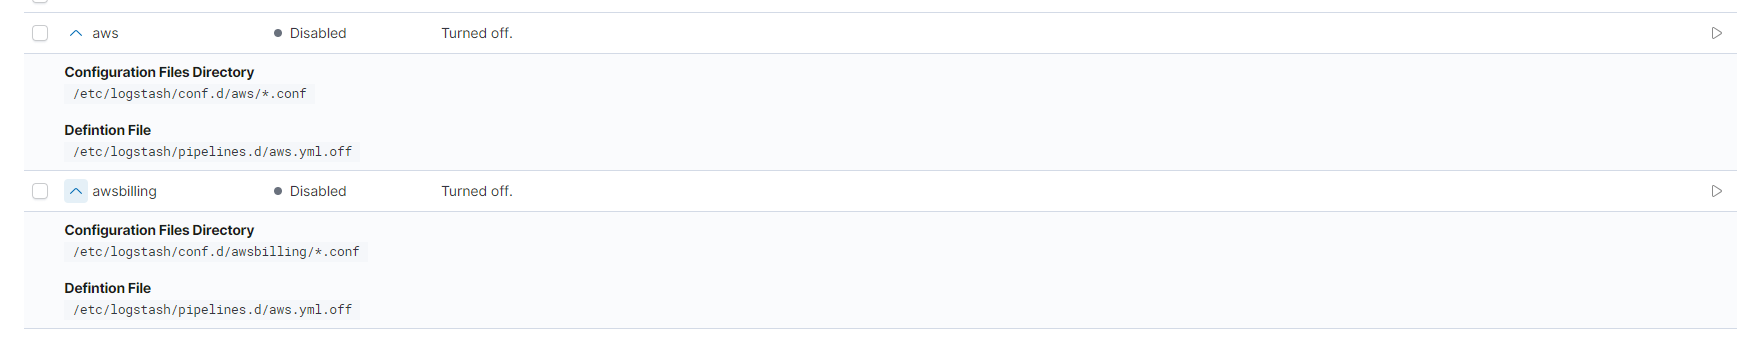
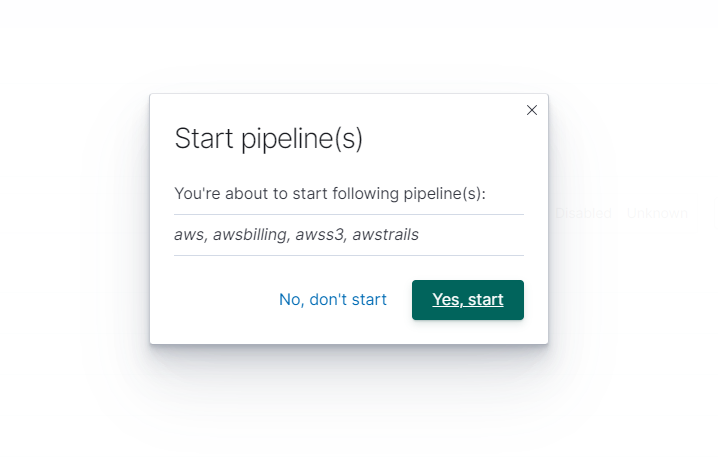
If one configuration file contains definitions for many pipelines at the same time, then, for example, despite selecting one, a given action will be performed for all pipelines defined in it, and an appropriate message will be displayed. Below is the message that will be displayed when clicking one of the 4 pipelines defined in the aws.yml file:
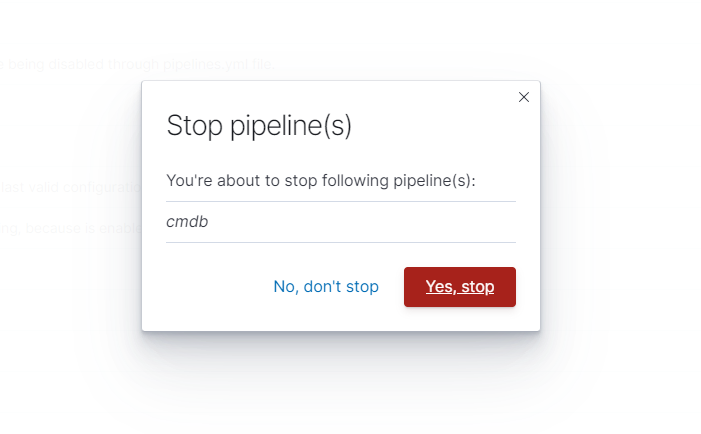
However, when stopping a single pipeline, the message may look like the following:
Files Section
This section is used to handle files managed by the probe. Here you can create, update, or delete files, and in some cases check their validation results.
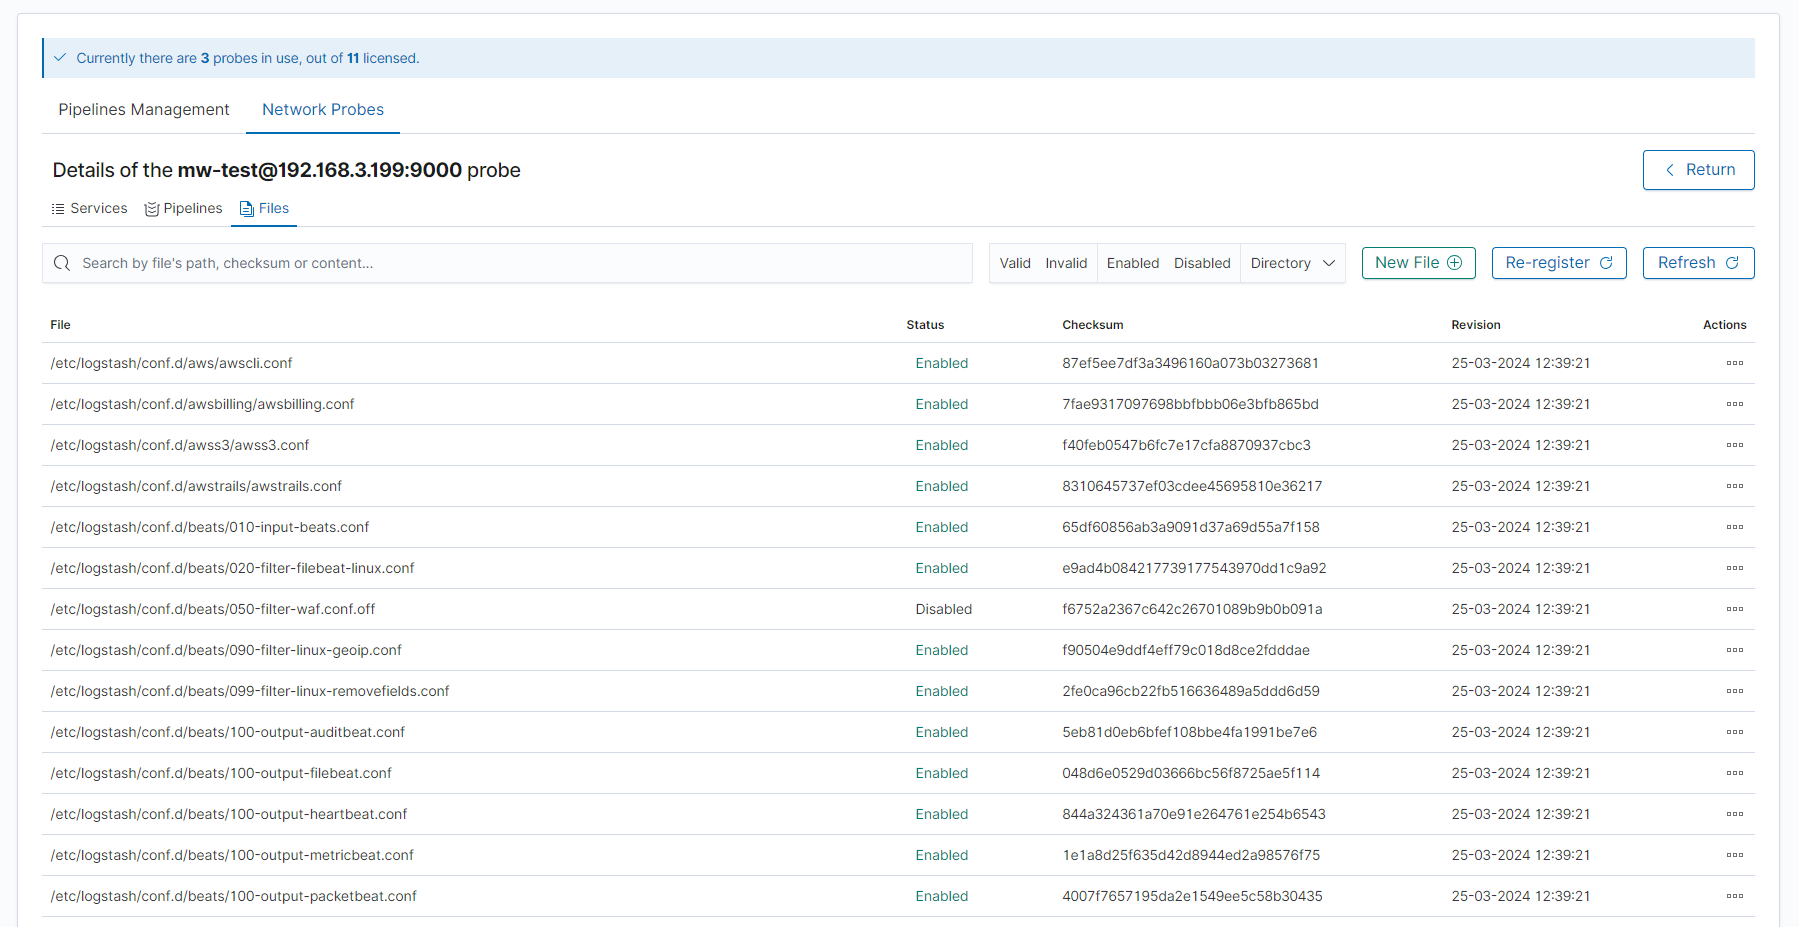
In the file table, we see information about the following:
file - file’s full path
status - status indicates whether the file is being used by the pipeline. If the file resides within the
/etc/logserver-probe/conf.ddirectory and has a.confextension, it can be either enabled or disabled.checksum - calculated checksum based on the file content
revision - date of the latest file version
In the table, we can also see warnings in the form of yellow warning icons in the event of parsing errors in selected files, which will be described later.
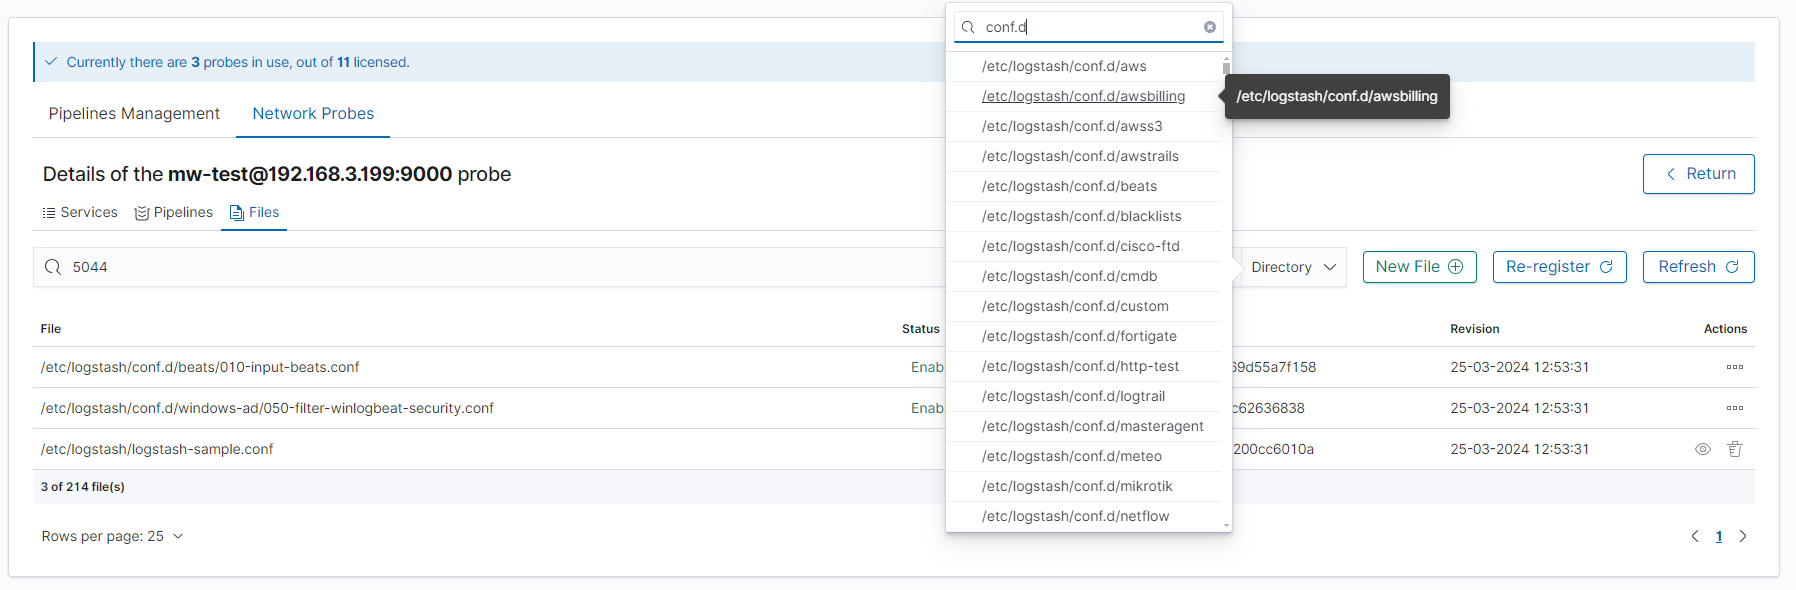
Filtering and searching
Files can be filtered based on three parameters:
Valid/Invalid- parsing correctness and if latest revision is up to dateEnabled/Disabled- current operating statusDirectory- the directory in which they are located
However, in addition to filtering, the search functionality based on its content, a fragment of the access path, or its checksum may help in finding a specific file.
In the example below, a directory filter was used and all files containing the “5044” phrase entered in the search bar were found.
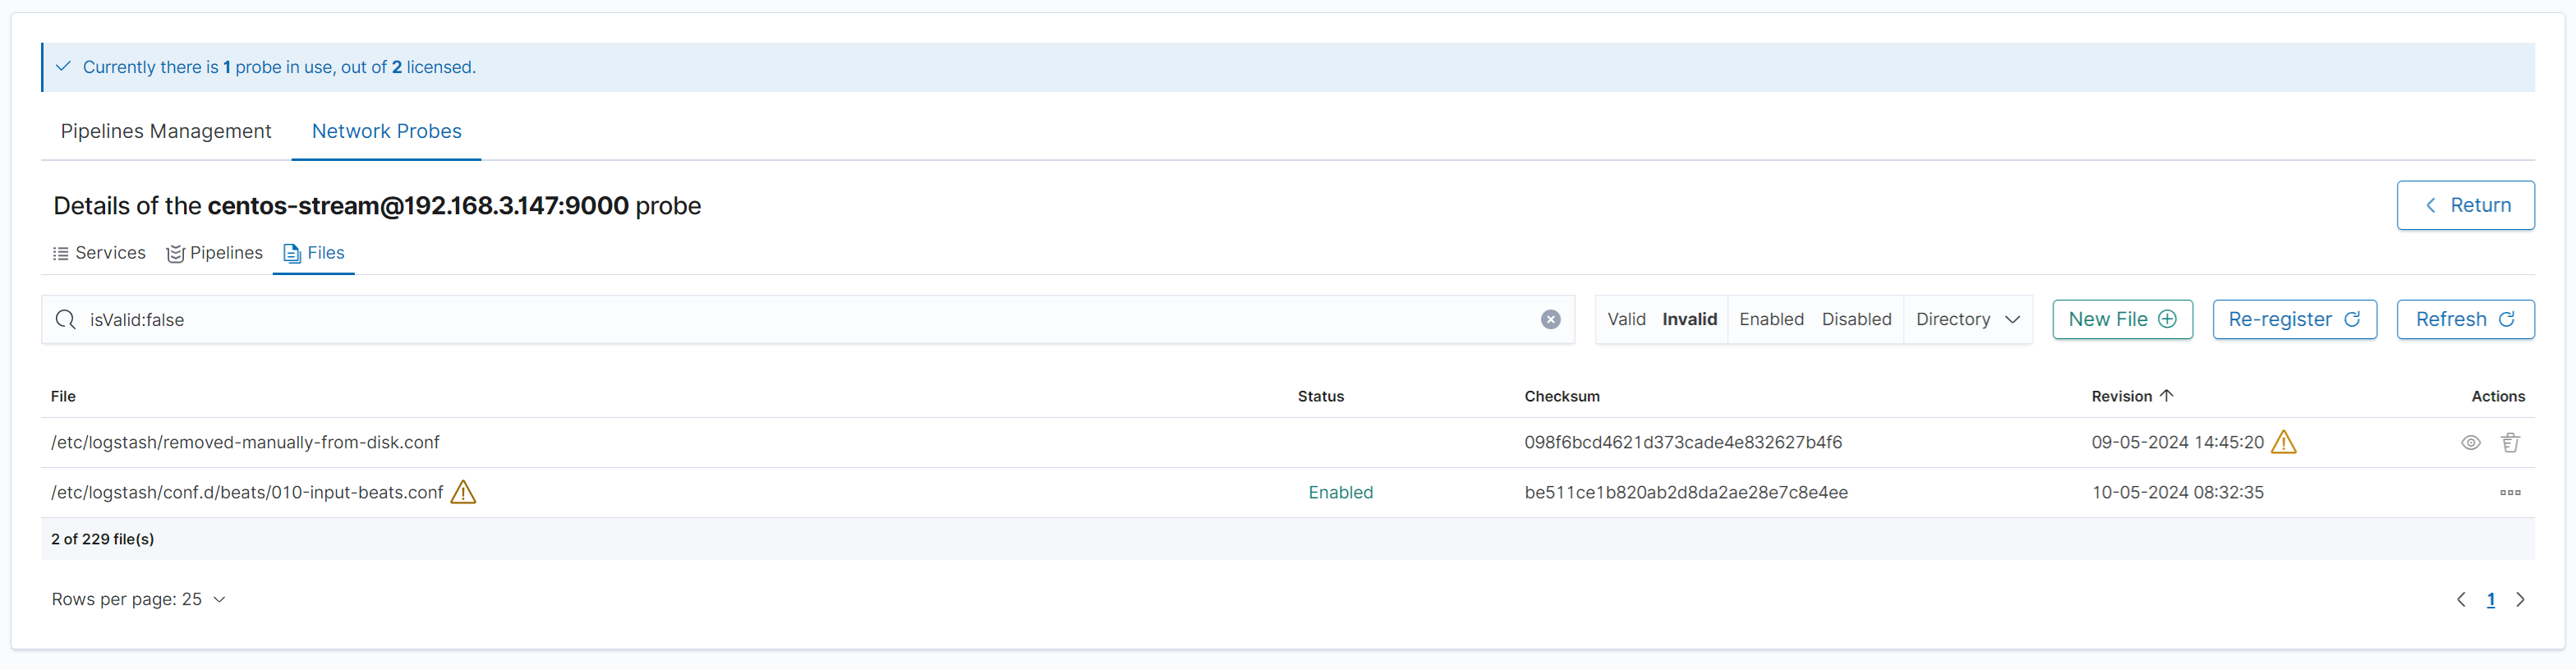
The next example shows the use of the first filter described. After filtering, the table contains only files whose current state is incorrect - either they have invalid content or their revision is out of date.
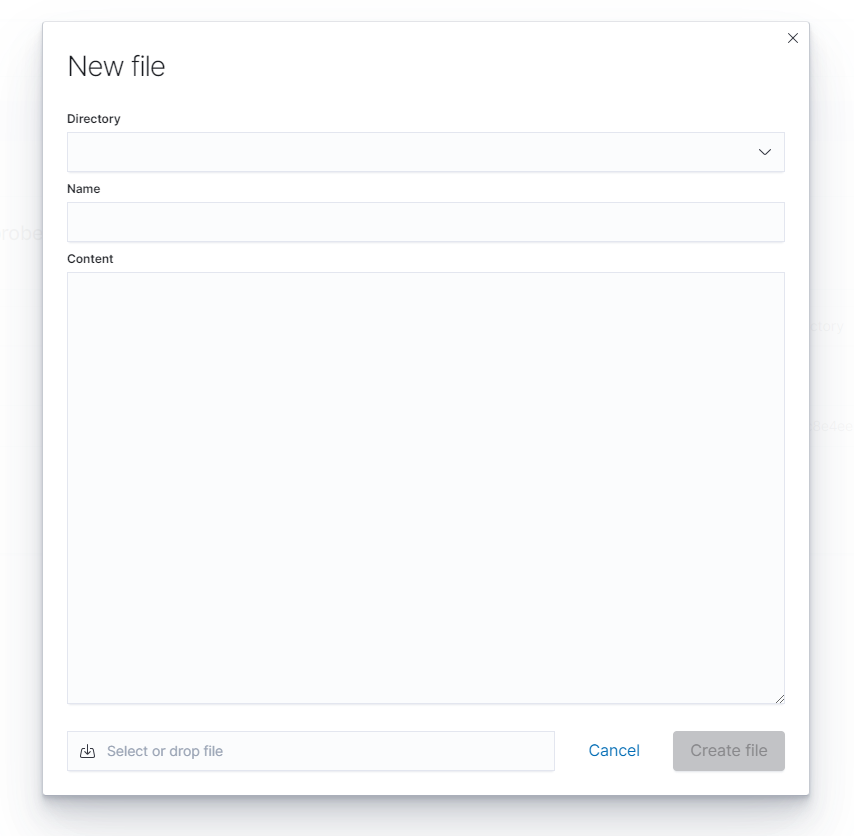
Create file
To create a new file, click the “New File” button. The file can be created in two ways: it can be created completely from scratch, or you can upload an existing file using the form in the lower left corner - the file name and its content will be uploaded. The available directories are directories managed by the probe - you cannot create a file in a place other than the allowed location.
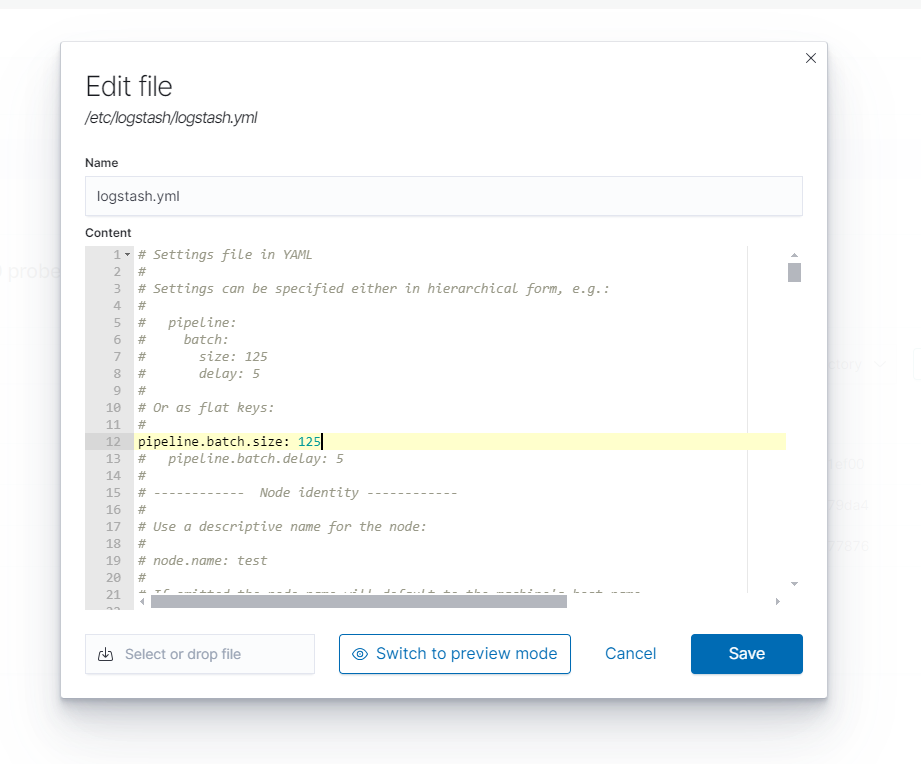
Update file
A previously created file can also be edited. As with creation, a file can be overwritten by uploading an existing one, or individual elements of the file can be edited, (such as name, or content).
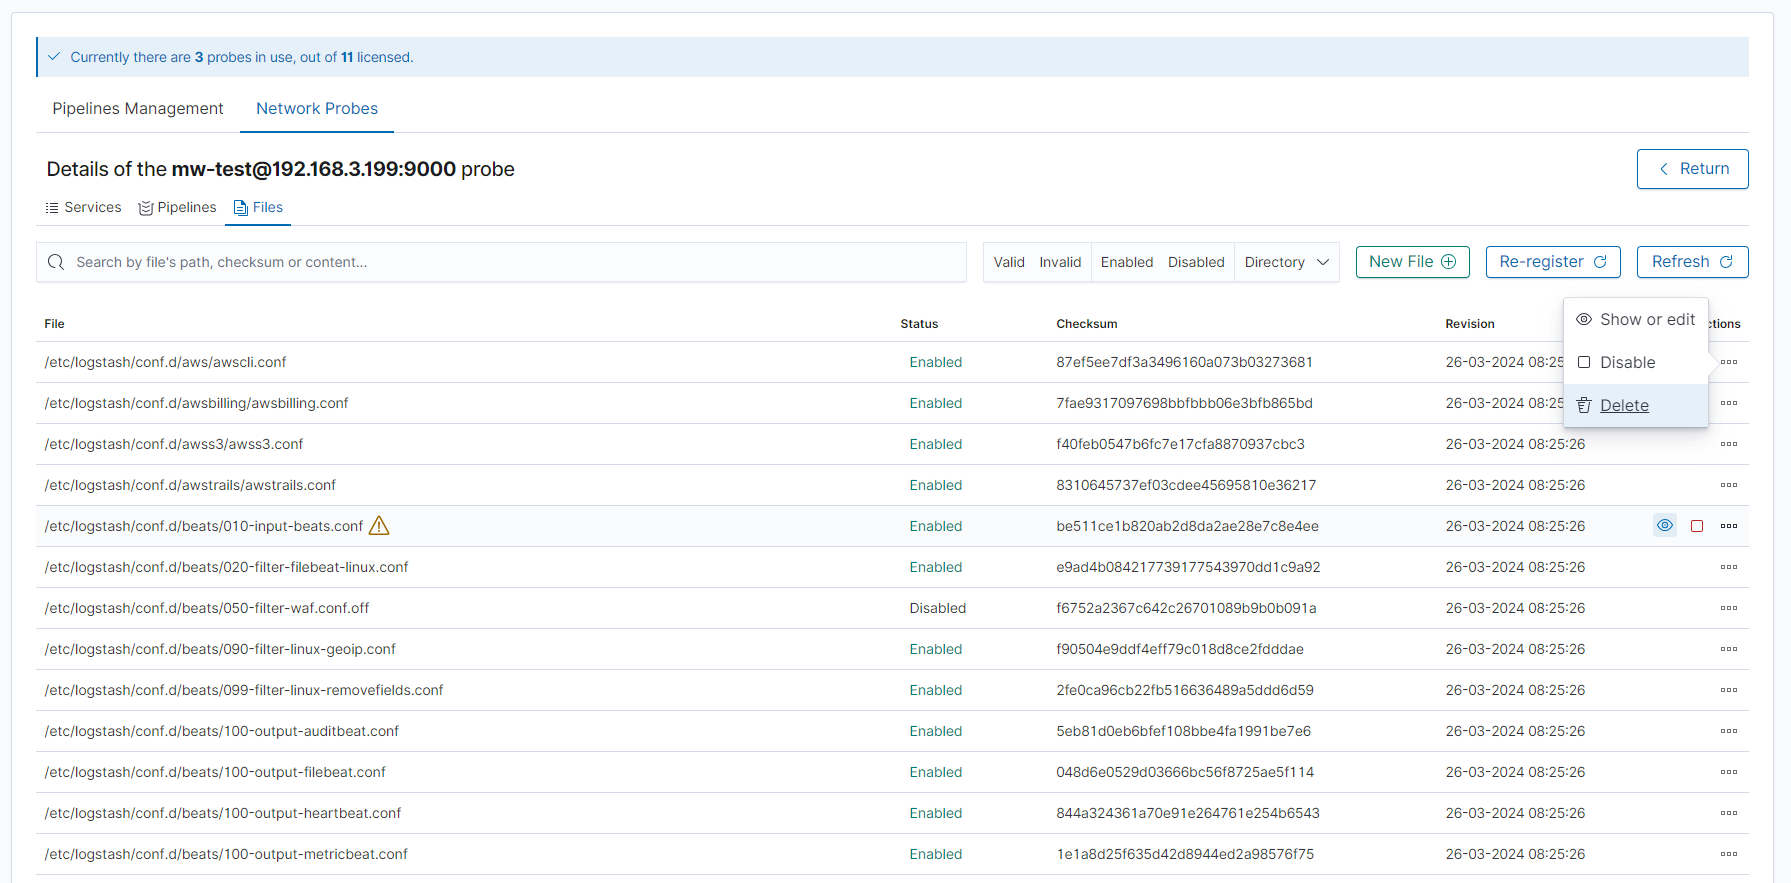
Delete file
An existing file can be deleted using the button to the right of the table row.
Enable/disable file
Pipeline configuration files can be either enabled or disabled. When a file is enabled it is being used by the corresponding pipeline. It can be disabled so that they are not taken into account, for example for testing purposes.
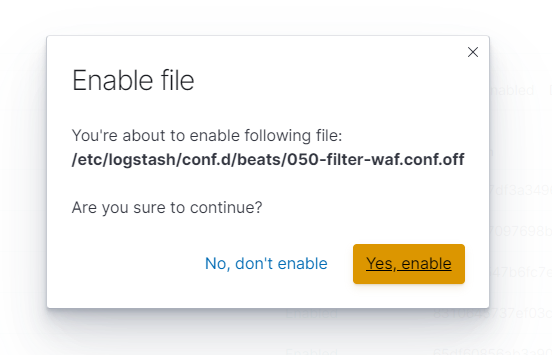
A similar confirmation modal will appear for disabling the file operation.
Files parsing
If the file is located in related directories and has the extension .conf, it is parsed to check its correctness.
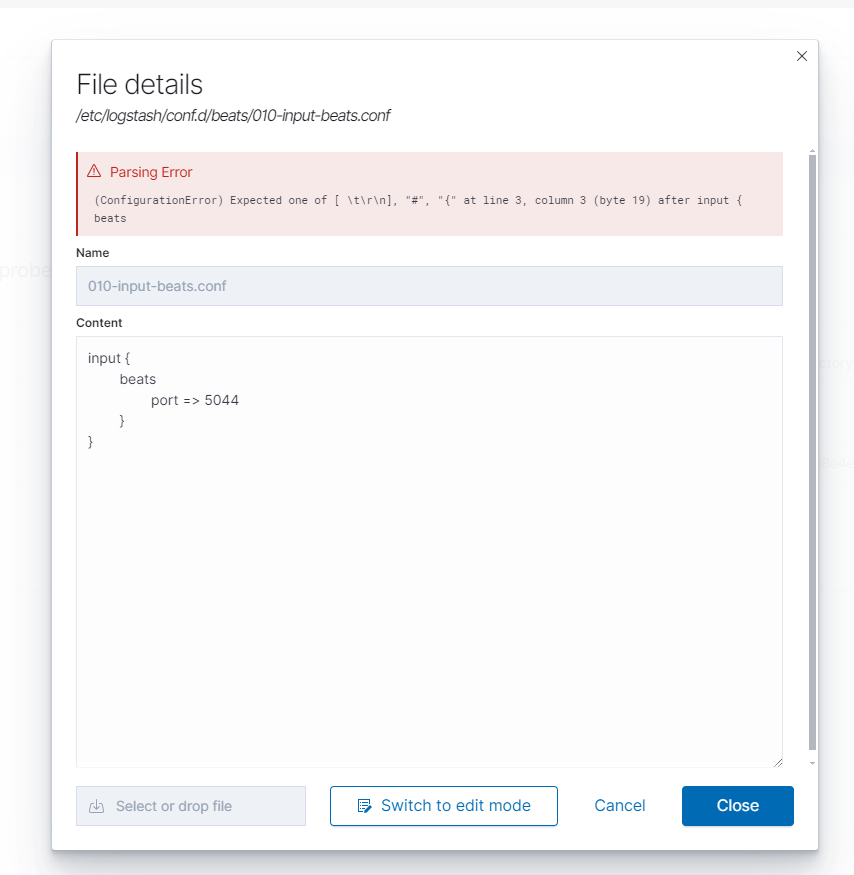
If the file cannot be parsed, a warning will appear in the list informing you about the error.
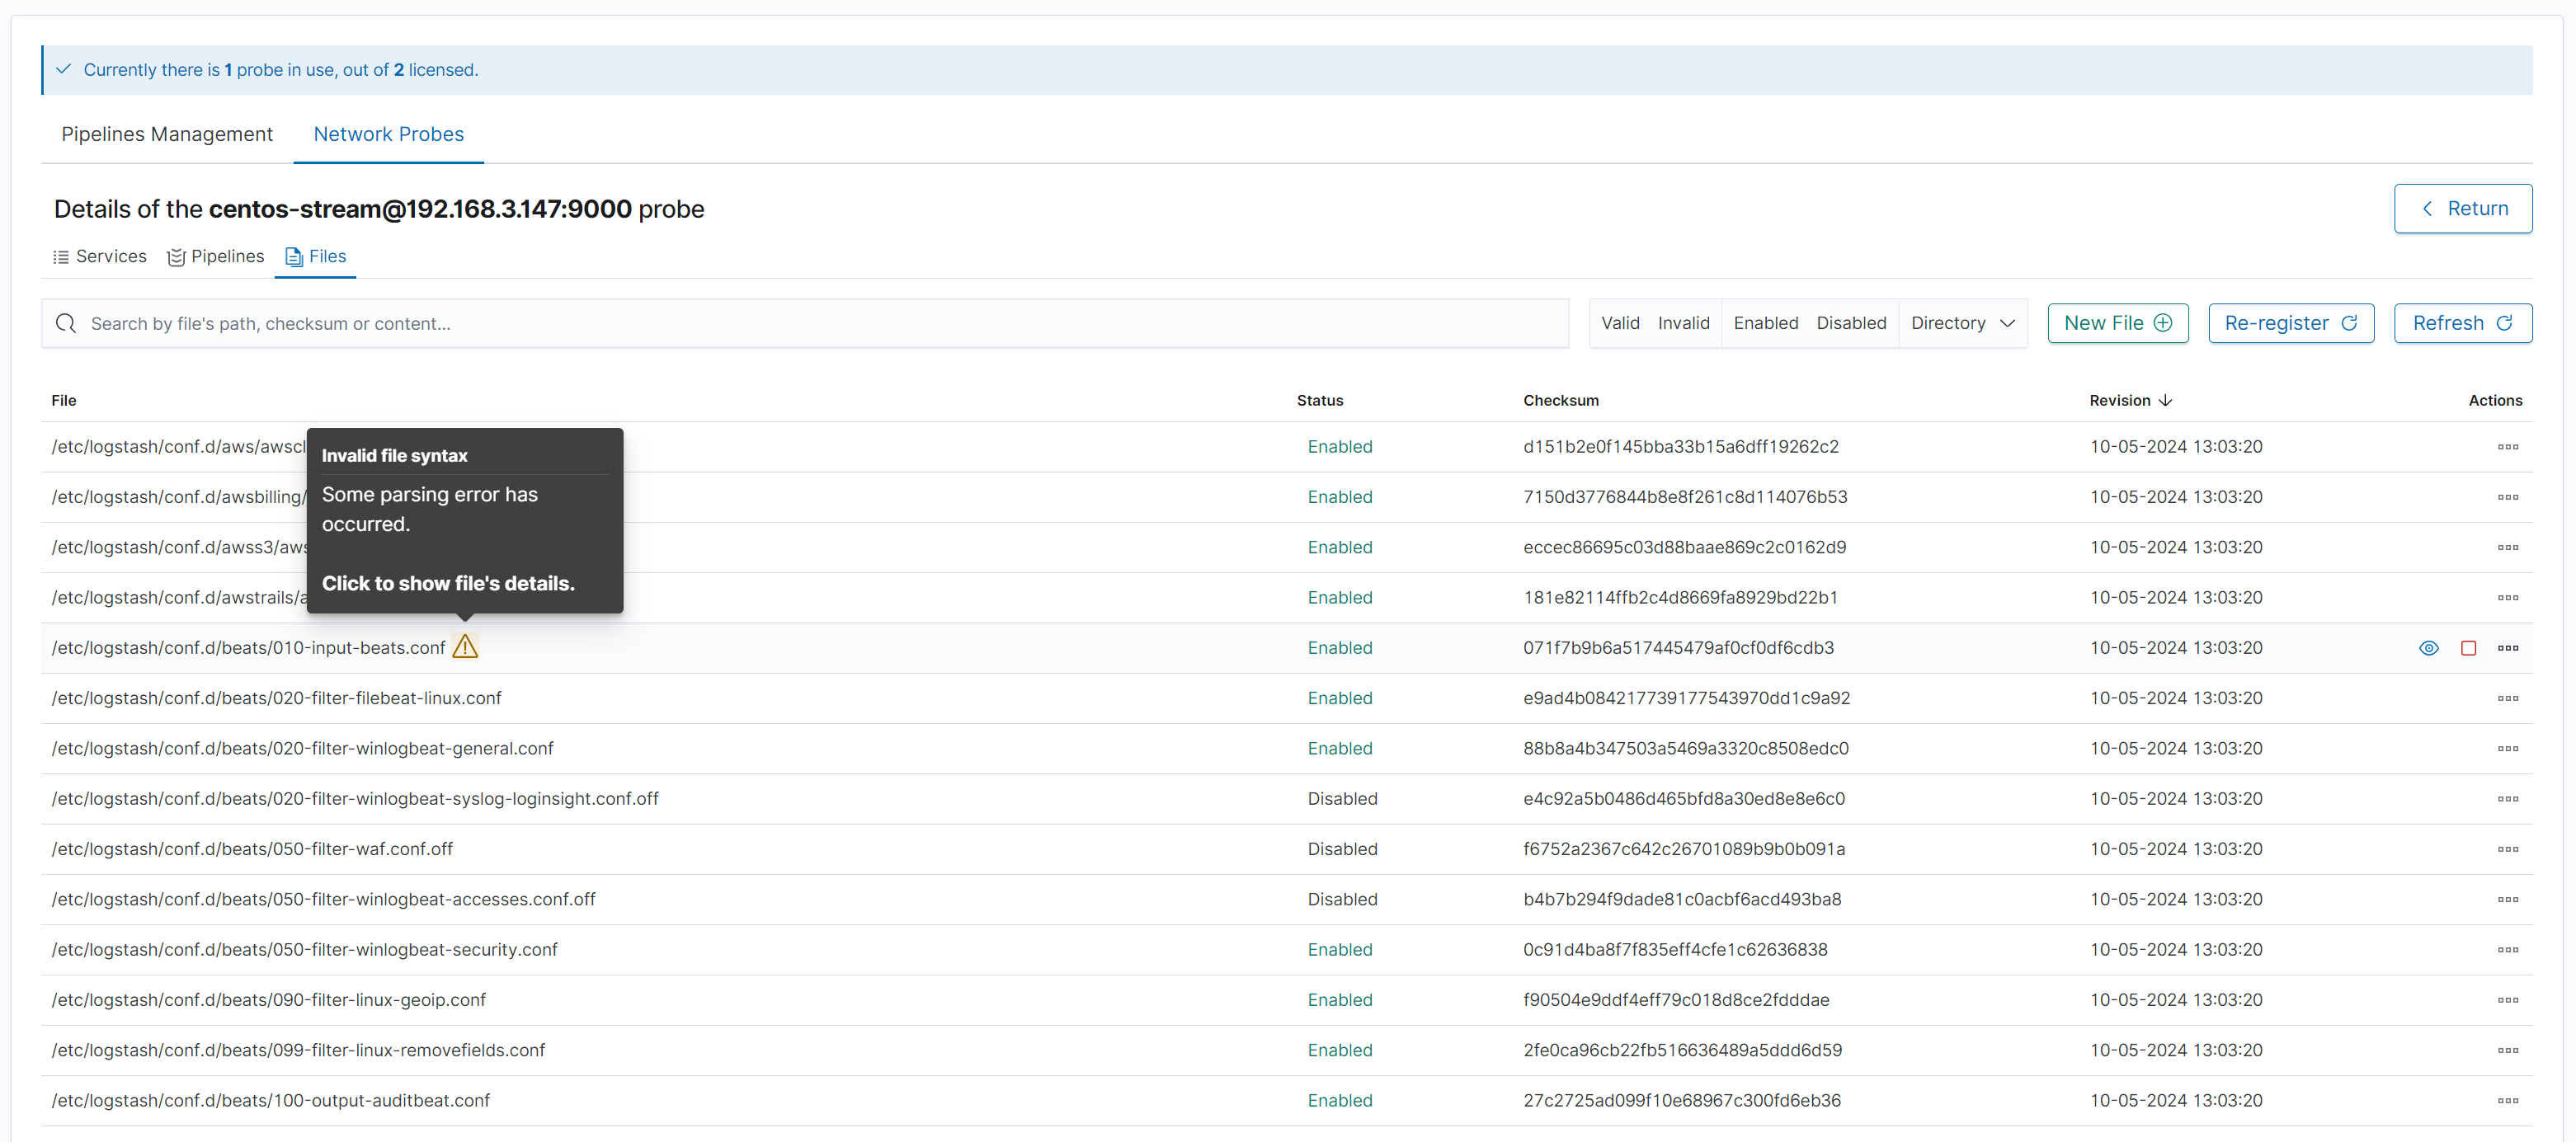
The warning icon can be clicked to review the error message and correct it if possible. After clicking, the following modal will show up:
In addition to the previously described .conf files, when .yml or .yaml files are created/edited, the built-in editor checks the correctness of the entered text, signaling any errors. If the file is incorrect, any creation or editing of the file will be blocked until the errors are corrected.
Files’ revision consistency
If a file managed by the service is accidentally deleted from the system or any inconsistencies are detected between the updates of the monitored files, the following warning will be displayed:
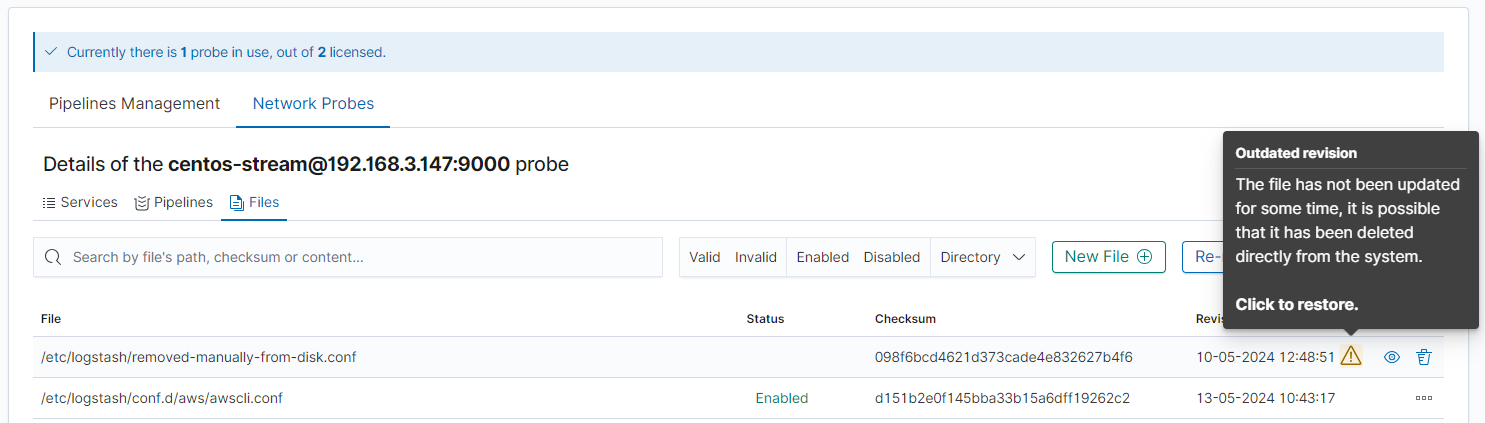
The warning icon can be clicked to recreate the file and restore it to the system.
Files re-registration
Files can be re-registered using the “Re-register” button. Using this functionality refreshes all monitored files, while simultaneously parsing pipeline configuration files.