Alerting System
Topics
Complete guide to configuring and managing security alerts in Energylogserver SIEM.
Complete guide to configuring and managing security alerts in Energylogserver SIEM.
Overview
Alerting in Energylogserver SIEM is your early warning system, automatically monitoring log data and generating notifications when security events occur. Developed by EMCA Software sp. z o.o., it acts as a vigilant security guard, ensuring continuous surveillance of your environment.
What is Alerting?
Alerting transforms raw log data into actionable security intelligence by detecting patterns, anomalies, and known threat indicators in real-time, supporting compliance and incident response.
Straightforward explanation:
What it is: An automated security event detection system.
How it works: Define rules; the system monitors data and alerts when matches occur.
What it does: Enables early threat detection, incident response, and compliance monitoring.
Key Benefits
🚨 Security Benefits:
Real-time threat detection: Immediate alerts on security events.
Automated monitoring: 24/7 surveillance without human intervention.
Faster incident response: Reduced detection-to-action time.
💼 Business Benefits:
Compliance automation: Alerts for regulatory adherence.
Reduced false positives: Intelligent filtering focuses on real threats.
Operational efficiency: Streamlined security workflows.
Alerting Interface Overview
The Energylogserver SIEM Alerting interface consists of 4 main tabs within the SIEM section:
Main Navigation Tabs
Access: ELS Console → SIEM → [Select Tab]
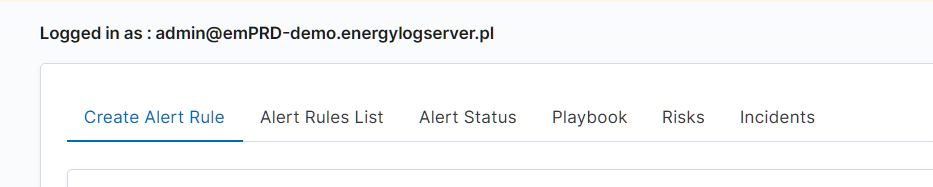
Widok główny SIEM: zakładki Incidents, Risks, Playbook, Alert Rules
Incidents - Manage active alerts and incidents.
Risks - Categorize and score risks.
Playbook - Automate response procedures.
Alert Rules - Create, manage, and review alert rules.
How Tabs Work Together
Alert Rules → Incidents → Playbooks → Risk Management
Workflow:
Define or enable alert rules.
Manage triggered incidents.
Execute automated playbooks.
Track and calculate risk scores.
Creating Your First Alert
Energylogserver allows you to create alerts, i.e., monitoring queries. These are constant queries that run in the background, and when the conditions specified in the alert are met, the specified action is taken.
For example, if you want to know when more than 20 “status:500” response codes from your homepage appear within one hour, then create an alert that checks the number of occurrences of the “status:500” query for a specific index every 5 minutes. If the condition is met, an action is sent, such as a message to an email address or launching a script.
Enabling the Alert Module
SMTP Server Configuration
To configure the SMTP server for email notifications, you should:
Edit
/opt/alert/config.ymland add the following section:# email conf smtp_host: "mail.example.conf" smtp_port: 587 smtp_ssl: false from_addr: "siem@example.com" smtp_auth_file: "/opt/alert/smtp_auth_file.yml"
Add the new
/opt/alert/smtp_auth_file.ymlfile:user: "user" password: "password"
Restart the
alertservice:systemctl restart alert
Quick Start: Alert Creation Wizard
Navigation: ELS Console → Discover → Alert (top right) or ELS Console → SIEM → Alert Rules → Create Alert Rule
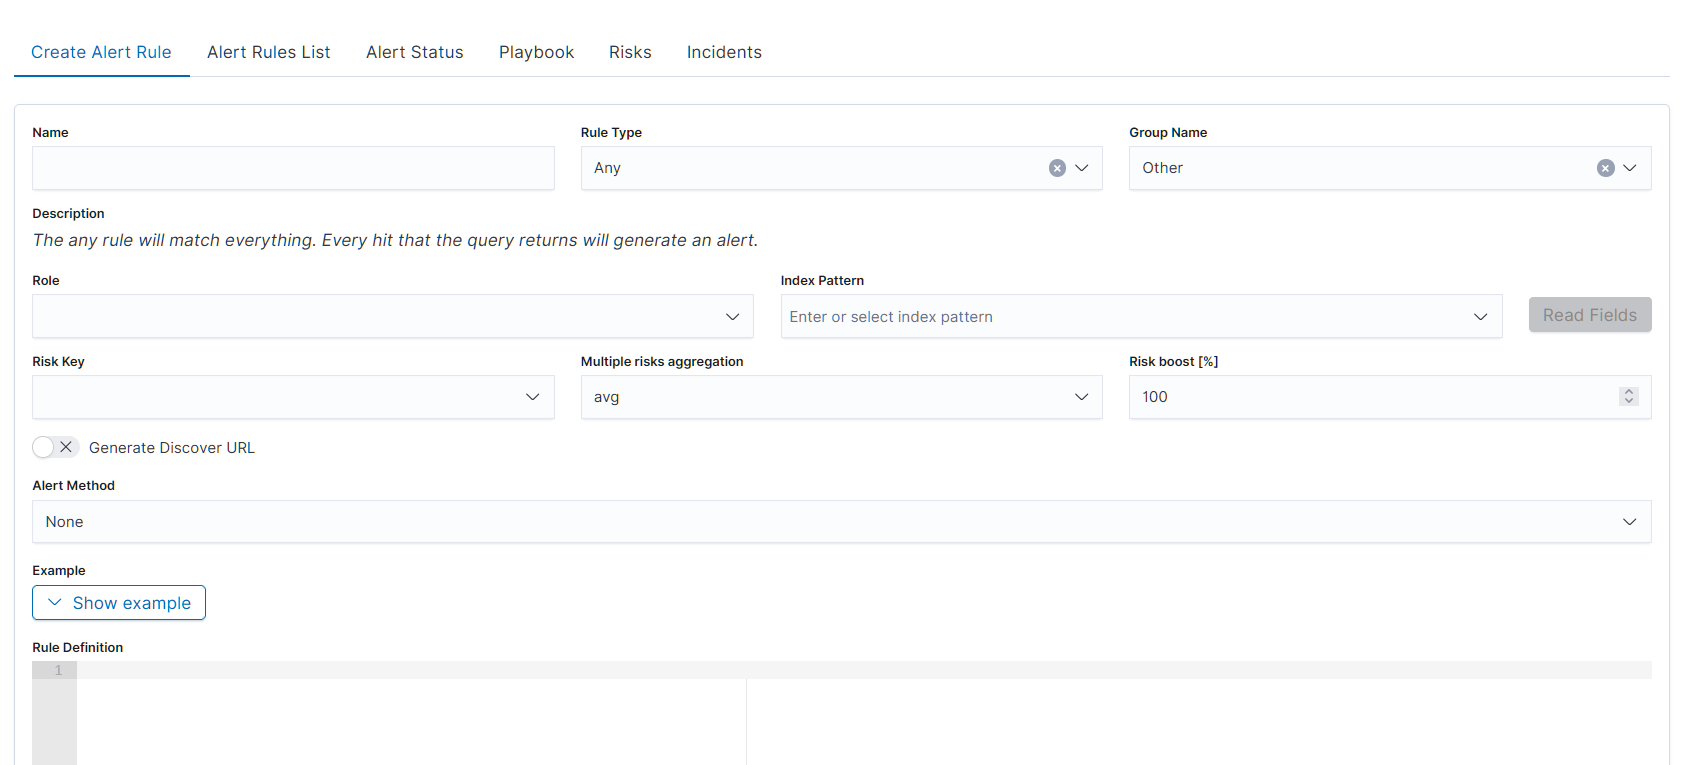
Formularz tworzenia nowej reguły: pola Name, Description, Index Patterns, Risk Level, Alert Method
To create an alert:
Navigate to Discover or SIEM → Alert Rules.
In Discover, build a query and select Alert (top right). In SIEM, click Create Alert Rule.
Complete the alert creation form:
Name: Enter a descriptive name (e.g., “Failed Login Attempts - Brute Force Detection”).
Description: Explain what the alert detects (e.g., “Detects multiple failed login attempts from the same IP within 5 minutes”).
Rule Type: Select from dropdown (e.g., Any, Frequency, Spike). See Alert Rule Types for options.
Role: Assign the user role for alert access.
Index Patterns: Specify data to monitor (e.g.,
windows-security-*,firewall-*,authentication-*).Time Range: Set the detection window (e.g., Last 15 minutes).
Filter: Add conditions (e.g.,
host = webserver).Query: Use Lucene query for specific conditions.
Group By: Aggregate by fields (e.g., host, user).
Field: Specify the data field to monitor.
Risk Key: Define risk calculation (e.g.,
source.ip,user.name).Risk Level: Set severity (Low/Medium/High/Critical).
Alert Method: Choose action (e.g., Email, Slack, Command). See Integration with Other Modules.
Recipients: Add email addresses or channels.
Message: Customize notification text.
Click Save Rule to create the alert.
Step 1: Basic Alert Information
Name: Enter a descriptive alert name.
Example: “Failed Login Attempts - Brute Force Detection”
Description: Explain what the alert detects.
Example: “Detects multiple failed login attempts from the same IP within 5 minutes indicating a potential brute force attack.”
Rule Type: Select from dropdown (e.g., Any, Frequency, Spike). (Note: Full list of types available in Alert Rule Types section below.)
Group Name: Organize alerts into groups for management.
Role: The role of the user for whom an alert will be available.
Step 2: Define Detection Logic
Rule: Write the detection query using Logserver DSL.
Example: Windows Logon Failure Detection
filter:
  - bool:
      filter:
        - match_phrase:
            winlog.event_id: '4625'
        - match_phrase:
            event.action: Logon
        - match_phrase:
            event.outcome: failure
Index Patterns: Specify data to monitor.
Examples:
windows-security-*(Windows security events)firewall-*(firewall logs)authentication-*(authentication logs)
Time Range: Set how far back to look (e.g., Last 15 minutes, Last hour).
Filter: Add conditions like host = webserver or user = admin.
Query: Use advanced Lucene query for specific conditions.
Group By: Aggregate alerts by host, user, or other fields.
Field: Specify the data field to monitor.
Step 3: Risk Configuration
Risk Key: Define how to calculate risk.
Examples:
source.ip(risk by source IP)user.name(risk by username)host.name(risk by hostname)
Risk Level: Set severity (Low/Medium/High/Critical).
Step 4: Alert Method
Alert Method Options:
None - Dashboard only (default).
Email - Email notifications. (Requires SMTP configuration as above.)
Slack - Slack channel notifications.
Webhook - Custom webhook integration.
PagerDuty - PagerDuty integration.
OpsGenie - OpsGenie integration.
ServiceNow - ServiceNow ticket creation.
Jira - Jira issue creation.
The Hive - The Hive integration.
EnergySoar - Energy Soar integration.
Command - Execute a command/script.
User - Notify defined system users.
Microsoft Teams - Microsoft Teams notifications.
Telegram - Telegram notifications.
Google Chat - Google Chat notifications.
RSA Archer - RSA Archer integration (via command/script).
Recipients: Add email addresses or channels.
Message: Customize alert notification text.
Save Rule: Click to create the alert rule.
List of Alert Rules
The “Alert Rule List” tab contains a complete list of previously created alert rules.
In this window, you can activate/deactivate, delete, and update alerts by clicking on the selected icon with the given alert.
Alerts Status
In the “Alert Status” tab, you can check the current alert status: whether it is activated, when it started and ended, how long it lasted, how many events it found, and how many times it worked.
Also, on this tab, you can recover the alert dashboard by clicking the “Recovery Alert Dashboard” button.
Alert Rule Types
Alert rule types define how the system detects events. Available types:
Basic Alerts
Any: Triggers on any matching event.
Blacklist: The blacklist rule will check a certain field against a blacklist, and match if it is in the blacklist.
Blacklist-IOC: The blacklist rule will check a certain field against a blacklist, and match if it is in the blacklist (can be used for large files).
Cardinality: This rule matches when the total number of unique values for a certain field within a time frame is higher or lower than a threshold.
Change: This rule will monitor a certain field and match if that field changes. The field must change with respect to the last event with the same query_key.
Consecutive Growth: Rule matches for value difference between two aggregations calculated for different periods in time.
Difference: This rule calculates percentage difference between aggregations for two non-overlapping time windows.
Required parameters:
type: difference- Enable the rule.compare_key: value- Field for aggregation calculation.threshold_pct: 10- Alert triggers when percentage difference exceeds this value.delta_min: 3- Difference in minutes between calculated aggregations.agg_min: 1- Aggregation bucket in minutes.
Optional parameters:
query_key: hostname- If present, calculates aggregation for each unique query_key (must be of type keyword).
Calculation:
For current time
x, historical and present time windows are defined as:<x – agg_min – delta_min; x – delta_min> <= <x – agg_min; x>, wherex – delta_min <= x – agg_min => delta_min >= agg_min.Percentage difference:
d = | avg_now – avg_history | / max(avg_now, avg_history) * 100(ifavg_now – avg_history != 0,avg_now != 0,avg_history != 0); otherwise,d = 0.avg_nowis the arithmetic mean of<x – agg_min; x>, andavg_historyis the arithmetic mean of<x – agg_min – delta_min; x – delta_min>.
Difference Multi Pattern: The rule matches the difference in values between two aggregations from two index patterns calculated in a unit of time.
Find Match: Rule matches when, in a defined period of time, two correlated documents match certain strings.
Flatline: Triggers when event count drops below threshold.
Frequency: This rule matches when there are at least a certain number of events in a given time frame.
Metric Aggregation: Aggregates metrics and alerts on thresholds.
New Term: Detects new values in a monitored field.
Percentage Match: This rule matches when the percentage of documents in the match bucket within a calculation window is higher or lower than a threshold.
Spike: Detects sudden increases in event frequency.
Unique Long Term: This rule matches when there are values of compare_key in each checked timeframe.
Whitelist: Similar to blacklist, this rule will compare a certain field to a whitelist, and match if the list does not contain the term.
Advanced Alerts
Chain: Combines multiple rules. Rule matches when a complex, logical criteria is met. Rule can be used for alert data correlation.
Example:
Alerts that must occur:
Linux - Login Failure: Must appear 10 times.
AND
Linux - Login Success: Must appear 1 time.
If the sequence of these alerts occurs within 5 minutes and the values of the “username” field are related, the alert rule is triggered. The order of occurrence is important.
Logical: Rule matches when a complex, logical criteria is met. Rule can be used for alert data correlation.
Example:
Alerts that must occur:
Switch - Port is off-line: Must appear 5 times.
OR
Switch - Port is on-line: Must appear 5 times.
If both alerts are met within 5 minutes and the values of the “port_number” field are related, the alert rule is triggered. Logical connectives such as OR, AND, NOR, NAND, XOR can be used.
Working with Pre-built Alert Groups
Navigation: ELS Console → SIEM → Alert Rules
Process
Browse pre-built groups (20+ available).
Select a group (e.g., “Windows Security”).
Review included rules.
Enable/disable individual rules.
Customize thresholds if needed.
Save and monitor.
Pre-built Groups Examples:
Brute Force Detection
Malware Indicators
Network Anomalies
User Behavior Monitoring
Compliance Violations