Monitoring and Performance
Topics
System monitoring with Skimmer, health dashboards, and performance optimization.
About Skimmer
Energylogserver uses a monitoring module called Skimmer to monitor the performance of its hosts. Metrics and conditions of services are retrieved using the API.
The services that are supported are:
Data Node metric;
Data Node indexing rate value;
Network Probe;
Logserver GUI;
Metricbeat;
Pacemaker;
Zabbix;
Zookeeper;
Kafka;
Kafka consumers lag metric
Httpbeat;
Elastalert;
Filebeat
and other.
Supported Services
Skimmer provides comprehensive monitoring for all Energylogserver components:
Data Node metrics - Energylogserver cluster health and performance
Data Node indexing rate - Events per second (EPS) monitoring
Network Probe - Logserver-Probe pipeline performance
ELS Console - GUI interface performance
Metricbeat - System metrics collection
Pacemaker - Cluster management status
Zabbix - External monitoring integration
Zookeeper - Distributed coordination service
Kafka - Message streaming platform
Kafka consumer lag - Processing queue monitoring
Httpbeat - HTTP endpoint monitoring
Elastalert - Alert processing engine
Filebeat - Log file collection
Supporting infrastructure - OS, network, storage
Key Benefits
Real-time Monitoring:
Continuous performance tracking
Health status monitoring for critical services
Resource utilization analysis
Proactive issue detection
Performance Optimization:
Bottleneck identification
Capacity planning recommendations
Performance trend analysis
Resource allocation optimization
Operational Visibility:
Centralized monitoring dashboard
Historical performance tracking
Service dependency monitoring
Alert correlation and management
Skimmer Installation
The RPM package skimmer-x86_64.rpm is delivered with the system installer in the “utils” directory:
cd $install_directory/utils
yum install skimmer-1.0.XX-x86_64.rpm -y
Package Installation
The Skimmer package is delivered with the Energylogserver system installer:
# Navigate to utilities directory
cd $install_directory/utils

# Install Skimmer package
yum install skimmer-1.0.XX-x86_64.rpm -y

# Verify installation
rpm -qa | grep skimmer

# Enable and start service
systemctl enable skimmer
systemctl start skimmer

# Check service status
systemctl status skimmer
Service Management
# Start/stop/restart Skimmer service
systemctl start skimmer
systemctl stop skimmer
systemctl restart skimmer

# Reload configuration without restart
systemctl reload skimmer

# View service logs
journalctl -u skimmer -f

# Check configuration syntax
skimmer --config-test
Skimmer service configuration
The Skimmer configuration is located in the /usr/share/skimmer/skimmer.conf file.
[Global] - applies to all modules
# path to log file
log_file = /var/log/skimmer/skimmer.log

# enable debug logging
# debug = true

[Main] - collect stats
main_enabled = true
# index name in Data Node
index_name = skimmer
index_freq = monthly

# type in Data Node index
index_type = _doc

# user and password to Data Node api
auth = logserver:logserver

# available outputs
Data Node address and port = 127.0.0.1:9200
Probe address and port = 127.0.0.1:6110

# retrieve from api
Data Node api = 127.0.0.1:9200
Network Probe api = 127.0.0.1:9600

# monitor kafka
# kafka_path = /usr/share/kafka/
# kafka_server_api = 127.0.0.1:9092
# comma separated kafka topics to be monitored, empty means all available topics
# kafka_monitored_topics = topic1,topic2
# comma separated kafka groups to be monitored, empty means all available groups (if kafka_outdated_version = false)
# kafka_monitored_groups = group1,group2
# switch to true if you use outdated version of kafka - before v.2.4.0
# kafka_outdated_version = false

# comma separated OS statistics selected from the list [zombie,vm,fs,swap,net,cpu]
os_stats = zombie,vm,fs,swap,net,cpu

# comma separated process names to print their pid
processes = /usr/sbin/sshd,/usr/sbin/rsyslogd

# comma separated systemd services to print their status
systemd_services = logserver,logserver-probe,logserver-gui,alert,cerebro

# comma separated port numbers to print if address is in use
port_numbers = 9200,9300,9600,5514,5044,443,5601,5602

# path to directory containing files needed to be csv validated
# csv_path = /opt/skimmer/csv/

[PSexec] - run powershell script remotely (skimmer must be installed on Windows)
ps_enabled = false
# port used to establish connection
# ps_port = 10000

# how often (in seconds) to execute the script
# ps_exec_step = 60

# path to the script which will be sent and executed on remote end
# ps_path = /opt/skimmer/skimmer.ps1

# available outputs
# Network Probe address and port = 127.0.0.1:6111
In the Skimmer configuration file, set the credentials to communicate with Data Node:
auth = \(user:\)password
To monitor the Kafka process and the number of documents in the queues of topics, run Skimmer on the Kafka server and uncheck the following section:
#monitor kafka
kafka_path = /usr/share/kafka/
kafka_server_api = 127.0.0.1:9092
#comma separated kafka topics to be monitored, empty means all available topics
kafka_monitored_topics = topic1,topic2
#comma separated kafka groups to be monitored, empty means all available groups (if kafka_outdated_version = false)
kafka_monitored_groups = group1,group2
# switch to true if you use outdated version of kafka - before v.2.4.0
kafka_outdated_version = false
kafka_path- path to Kafka home directory (requirekafka-consumer-groups.sh);kafka_server_api- IP address and port for kafka server API (default: 127.0.0.1:9092);kafka_monitored_groups- comma separated list of Kafka consumer group, if you do not define this parameter, the command will be invoked with the--all-groupsparameter;kafka_outdated_version= true/false, if you use outdated version of kafka - before v.2.4.0 set:true
After the changes in the configuration file, restart the service.
systemctl restart skimmer
Skimmer GUI configuration
To view the collected data by the skimmer in the GUI, you need to add an index pattern.
Go to the “Management” -> “Index Patterns” tab and press the “Create Index Pattern” button. In the “Index Name” field, enter the formula skimmer- *, and select the “Next step” button. In the “Time Filter” field, select @timestamp and then press “Create index pattern”
In the “Discovery” tab, select the skimmer- * index from the list of indexes. A list of collected documents with statistics and statuses will be displayed.
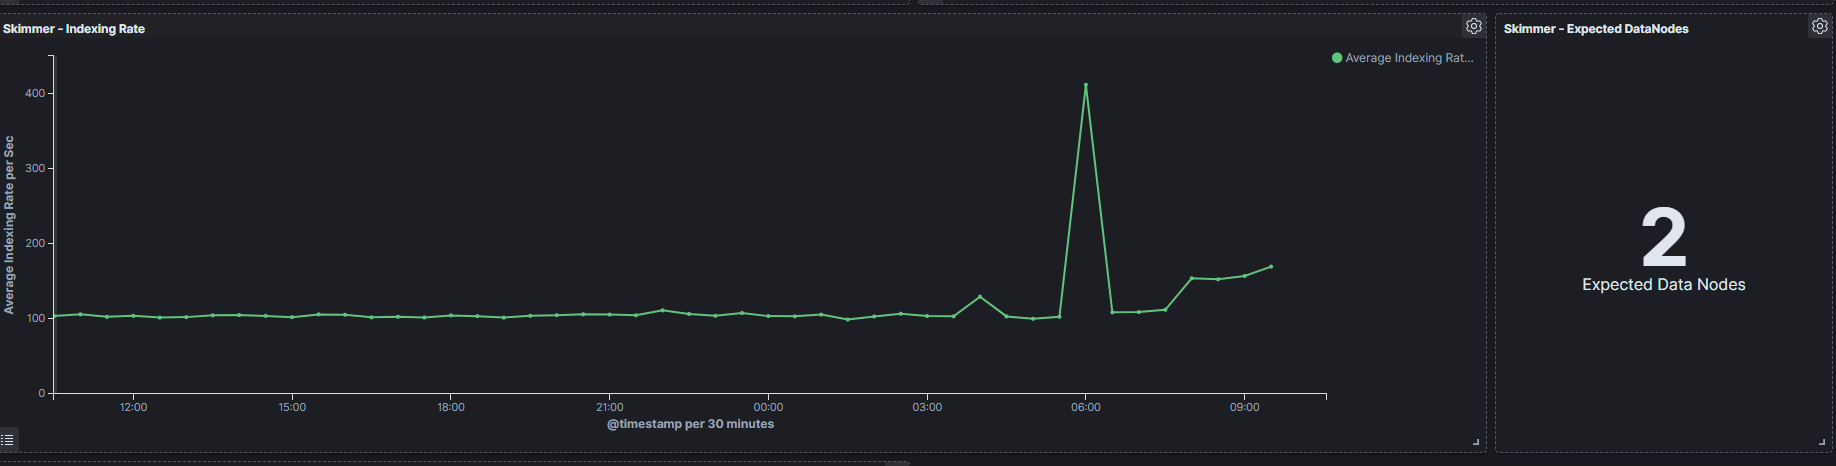
The Skimmer dashboard includes the following monitoring parameters:
Data Node - Heap usage in percent- is the total amount of Java heap memory that’s currently being used by the JVM Data Node process in percentNetwork Probe - Heap usage in percent- is the total amount of Java heap memory that’s currently being used by the JVM Network Probe process in percentData Node - Process CPU usage- is the amount of time for which a central processing unit was used for processing instructions of Elsticsearch process in percentData Node - Node CPU usage- is the amount of time for which a central processing unit was used for processing instructions for specific node of Data Node in percentData Node - Current queries- is the current count of the search query to Data Node indicesData Node - Current search fetch- is the current count of the fetch phase for search query to Data Node indicesGC Old collection- is the duration of Java Garbage Collector for Old collection in millisecondsGC Young collection- is the duration of Java Garbage Collector for Young collection in millisecondsFlush- is the duration of Data Node Flushing process that permanently save the transaction log in the Lucene index (in milliseconds).Refresh- is the duration of Data Node Refreshing process that prepares new data for searching (in milliseconds).Indexing- is the duration of Data Node document Indexing process (in milliseconds)Merge- is the duration of Data Node Merge process that periodically merged smaller segments into larger segments to keep the index size at bay (in milliseconds)Indexing Rate- an indicator that counts the number of saved documents in the Data Node index in one second (event per second - EPS)Expected DataNodes- indicator of the number of data nodes that are required for the current loadFree Space- Total space and Free space in bytes on Data Node cluster
Expected Data Nodes
Based on the collected data on the performance of the Energylogserver environment, the Skimmer automatically indicates the need to run additional data nodes.
Global Configuration
[Global]
# Path to log file
log_file = /var/log/skimmer/skimmer.log

# Enable debug logging (for troubleshooting)
# debug = true

# Log level (info, debug, error)
log_level = info
Data Node Configuration
[DataNode]
enabled = true
hosts = localhost:9200
username = monitoring_user
password = password
index = skimmer-metrics
interval = 60s
metrics =
  - cluster_health
  - indexing_rate
  - memory_usage
  - disk_usage
Network Probe Configuration
[NetworkProbe]
enabled = true
hosts = network-probe-01:9600
metrics =
  - pipeline_throughput
  - packet_drop_rate
  - processing_latency
interval = 30s
ELS Console Configuration
[ELSConsole]
enabled = true
host = localhost:5601
metrics =
  - request_rate
  - response_time
  - session_count
interval = 60s
Skimmer Dashboards
The Skimmer dashboards provide visualizations for the collected metrics.
Monitoring Parameters
The Skimmer dashboard includes the following monitoring parameters:
Data Node - Heap usage in percent- is the total amount of Java heap memory that’s currently being used by the JVM Data Node process in percentNetwork Probe - Heap usage in percent- is the total amount of Java heap memory that’s currently being used by the JVM Network Probe process in percentData Node - Process CPU usage- is the amount of time for which a central processing unit was used for processing instructions of Elsticsearch process in percentData Node - Node CPU usage- is the amount of time for which a central processing unit was used for processing instructions for specific node of Data Node in percentData Node - Current queries- is the current count of the search query to Data Node indicesData Node - Current search fetch- is the current count of the fetch phase for search query to Data Node indicesGC Old collection- is the duration of Java Garbage Collector for Old collection in millisecondsGC Young collection- is the duration of Java Garbage Collector for Young collection in millisecondsFlush- is the duration of Data Node Flushing process that permanently save the transaction log in the Lucene index (in milliseconds).Refresh- is the duration of Data Node Refreshing process that prepares new data for searching (in milliseconds).Indexing- is the duration of Data Node document Indexing process (in milliseconds)Merge- is the duration of Data Node Merge process that periodically merged smaller segments into larger segments to keep the index size at bay (in milliseconds)Indexing Rate- an indicator that counts the number of saved documents in the Data Node index in one second (event per second - EPS)Expected DataNodes- indicator of the number of data nodes that are required for the current loadFree Space- Total space and Free space in bytes on Data Node cluster
Integration with Other Modules
Data Flow Integration
Skimmer → Log Management → SIEM Plan → Alerting → Visualizations
Integration with Log Management
Data processing:
Performance metrics forwarded to Log Management for storage
Health data integrated with retention policies
Resource usage combined with log data for correlation
Integration with SIEM Plan
Security monitoring:
Health metrics displayed in SIEM dashboards
Performance alerts triggering SIEM notifications
Capacity analysis enhancing SIEM investigations
Integration with Alerting
Alert generation:
Performance anomalies triggering security alerts
Health degradations generating proactive notifications
Capacity warnings integrated with alert workflows
External System Integration
Automated monitoring data forwarding:
external_integration:
  webhook:
    url: "https://monitoring.company.com/api/skimmer-metrics"
    triggers:
      - cpu_usage: "> 90%"
      - memory_usage: "> 80%"
      - packet_drop_rate: "> 5%"
    payload:
      type: "%{metric_type}"
      value: "%{metric_value}"
      timestamp: "%{@timestamp}"
      affected_component: "%{component}"
      context: "%{metric_context}"