Anomaly Detection
Text Anomaly Detection focuses on analyzing words in log data, searching for anomalies. For each stream of logs algorithm will store statistical model containing calculated probability of word occurance. Each source produce different type of log typical for the vendor. Using statistical approach we can easly identify uncommon entries and detect suspicious behaviour in logs. Trained models can be saved in Model Library and used in real time in Network Probe pipeline.
Options
Set Use case name
Choose Your data: use Saved Search or provide index pattern and query
Narrow down analysis to certain fields
Choose or add a category
Exclude Pattern & Words: Exclude specific patterns or words from the analysis
Rareness Threshold: Set the threshold for word rarity in analyzed documents
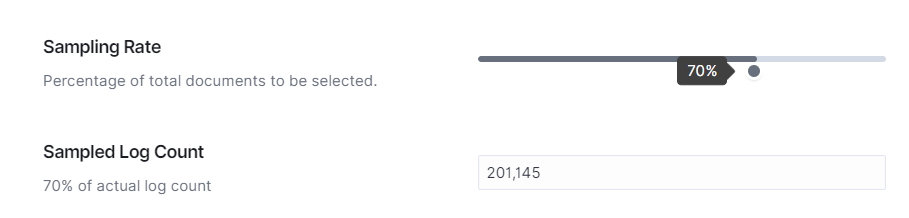
Sampling Rate: Control the percentage of sampled documents for analysis
Skipping Numerical Values: Automatically skip irrelevant numerical data during analysis
Create Alert: Automatically create alert rules for detected anomalies
Exclude Pattern & Words: Define patterns and words to be excluded from the analysis.
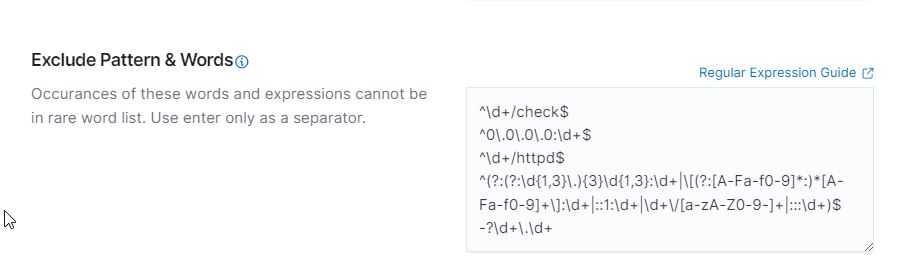
Skip numbers: Skip irrelevant numerical data during analysis. Each number can significantly boost false-positive ratio

Actual Log Count: Gives information about number of documents after applying saved search and build time frame - if number becomes hudge, consider using sampling
Sampling Rate: Adjust the percentage of documents to be sampled for analysis, sampling algorithm use dynamic approach randomly selecting number of logs
Rareness Threshold: Set thresholds for detecting rare words.

Create Alert: Automatically create alerts for detected anomalies.

Summary
The Text Anomaly Detection feature in the Empowered AI module offers robust tools for analyzing textual data to identify anomalies. Key features include the ability to create alerts automatically for detected anomalies, and apply default rules at startup. Users can exclude specific patterns and words from the analysis, set thresholds for detecting rare words, control the sampling rate of documents, and skip irrelevant numerical values during analysis.
Proper configuration and utilization of these features enable effective monitoring and detection of anomalies in textual data, enhancing overall security posture.
Performance Tab for Text Anomaly Detection
Understanding the Performance Graphs
Anomalies Over Time Chart: Displays detected anomalies over time. The X-axis represents time, while the Y-axis represents the number of detected anomalies.
Spread of Anomalies Chart: Shows the distribution of detected anomalies across the dataset. Each dot represents an anomaly score.
Using the Performance Graphs
Monitoring Trends: Allows you to monitor trends and identify periods of abnormal activity.
Investigating Anomalies: By examining the anomaly markers, you can investigate the corresponding timestamps to understand the context.
Adjusting Parameters: If too many or too few anomalies are detected, consider adjusting the rareness threshold or sampling rate.
Anomaly Detection Table
At the bottom of the Performance tab, there is an anomaly detection table that provides detailed information about each detected case.
Anomaly Detection Table
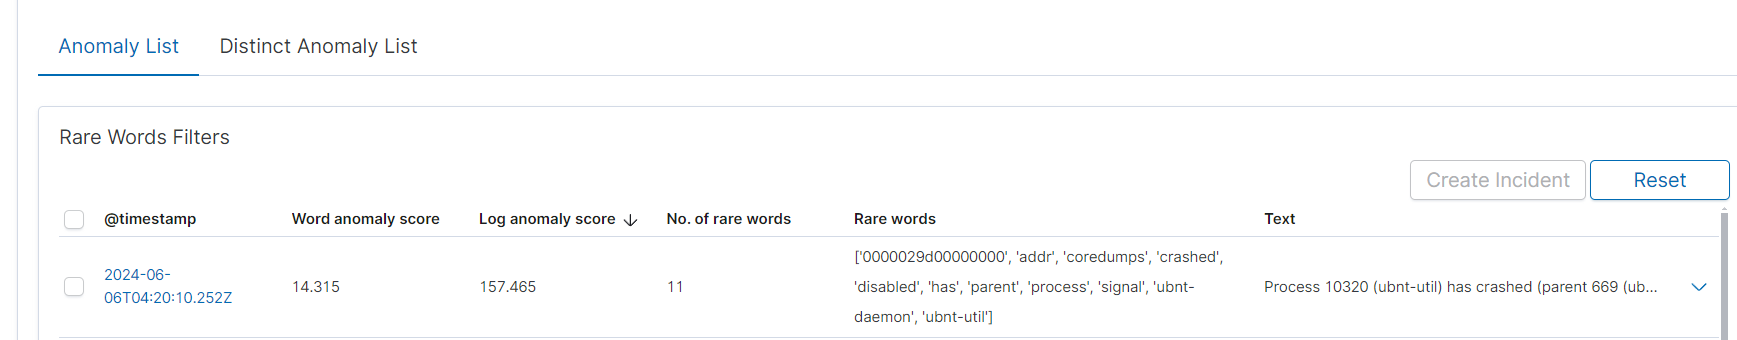
Information in the Anomaly Detection Table:
@timestamp: The timestamp when the anomaly was detected.
Word anomaly score: The anomaly score for the word, indicating the level of atypicality.
Log anomaly score: The anomaly score for the entire log.
No. of rare words: The number of rare words detected in the log.
Rare words: The list of rare words detected in the log.
Text: A fragment of the text containing the detected anomalies.
Expanding a Row
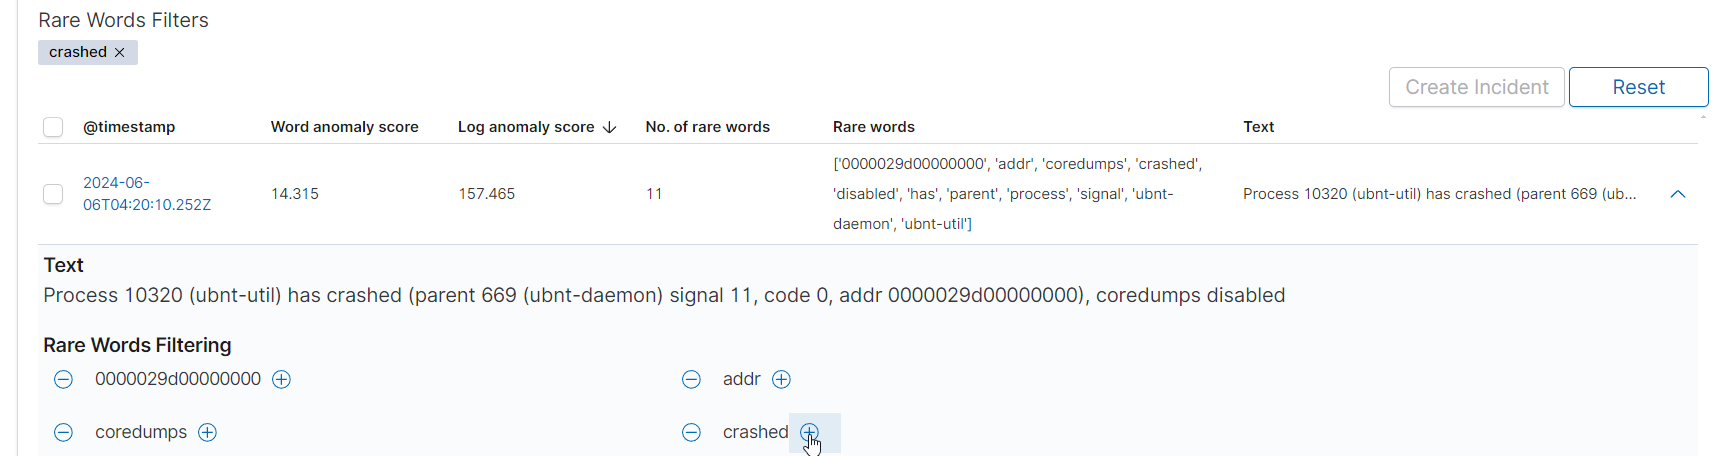
Click the arrow icon next to a specific row to expand detailed information about the anomaly. After expanding the row, you will see the full text containing the anomaly and the list of rare words that have been identified.
Filtering by Rare Words
At the top of the table, there is a Rare Words Filters section that allows you to filter anomalies based on rare words. You can enter a rare word to see only the logs that contain that word. To add a filter, click the + icon next to the word. To remove a filter, click the - icon.
Actions in the Table
Create Incident: A button that allows you to create an incident based on the selected anomaly.
Reset: A button that allows you to reset the filter and refresh the table.
Distinct Anomaly List Table
The Distinct Anomaly List tab contains the same anomaly data as the first table but without duplicates. If the message is the same, it is displayed only once. In the first table, all analyzed documents detected as anomalies are displayed, even if one document appears 200 times.
Summary
The Performance Tab in Text Anomaly Detection provides key information about detected anomalies. Various charts and tables allow users to visualize anomalies over time, understand their distribution, and review detailed information about each detected anomaly. Correct interpretation of these visualizations is crucial for effectively leveraging anomaly detection capabilities.
Univariate Anomaly Detection
Univariate Anomaly Detection identifies anomalies in a single number field. Below is a guide on configuring Univariate Anomaly Detection, highlighting its unique settings.
Step 1: Configuring the Univariate Anomaly Detection Rule
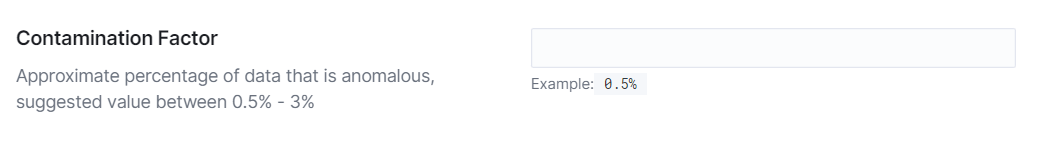
Contamination Factor: This setting defines the approximate percentage of data considered anomalous. The suggested value lower than 5%.
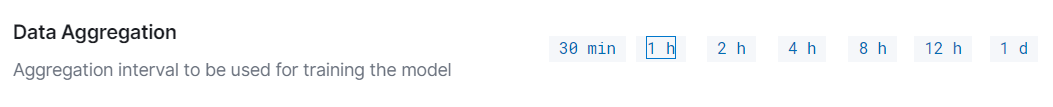
Data Aggregation: Select the aggregation interval to be used for training the model. Available intervals are 30 minutes, 1 hour, 2 hours, 4 hours, 8 hours, 12 hours, and 1 day.
Complete the configuration of other settings, such as Start Date, Build Time Frame, Scheduler options, and Field to Analyse. These settings are the same as those described in the common configuration guide.
Step 2: Running the Rule
After configuring all settings, click Save to save the rule, then click Run to start the anomaly detection process or Save & Run to start process imidietly.
Summary
Configuring Univariate Anomaly Detection in the Empowered AI module involves setting the contamination factor and selecting the data aggregation interval.
Performance Tab for Univariate Anomaly Detection
The Performance Tab provides a visual representation of the model’s performance, particularly focusing on the detected anomalies in a single data column over time.
Understanding the Performance Graph
The performance graph displays the actual values of the monitored data and highlights detected anomalies. The x-axis represents the timeline, while the y-axis shows the values of the selected data field, such as netflow.bytes in the given example.
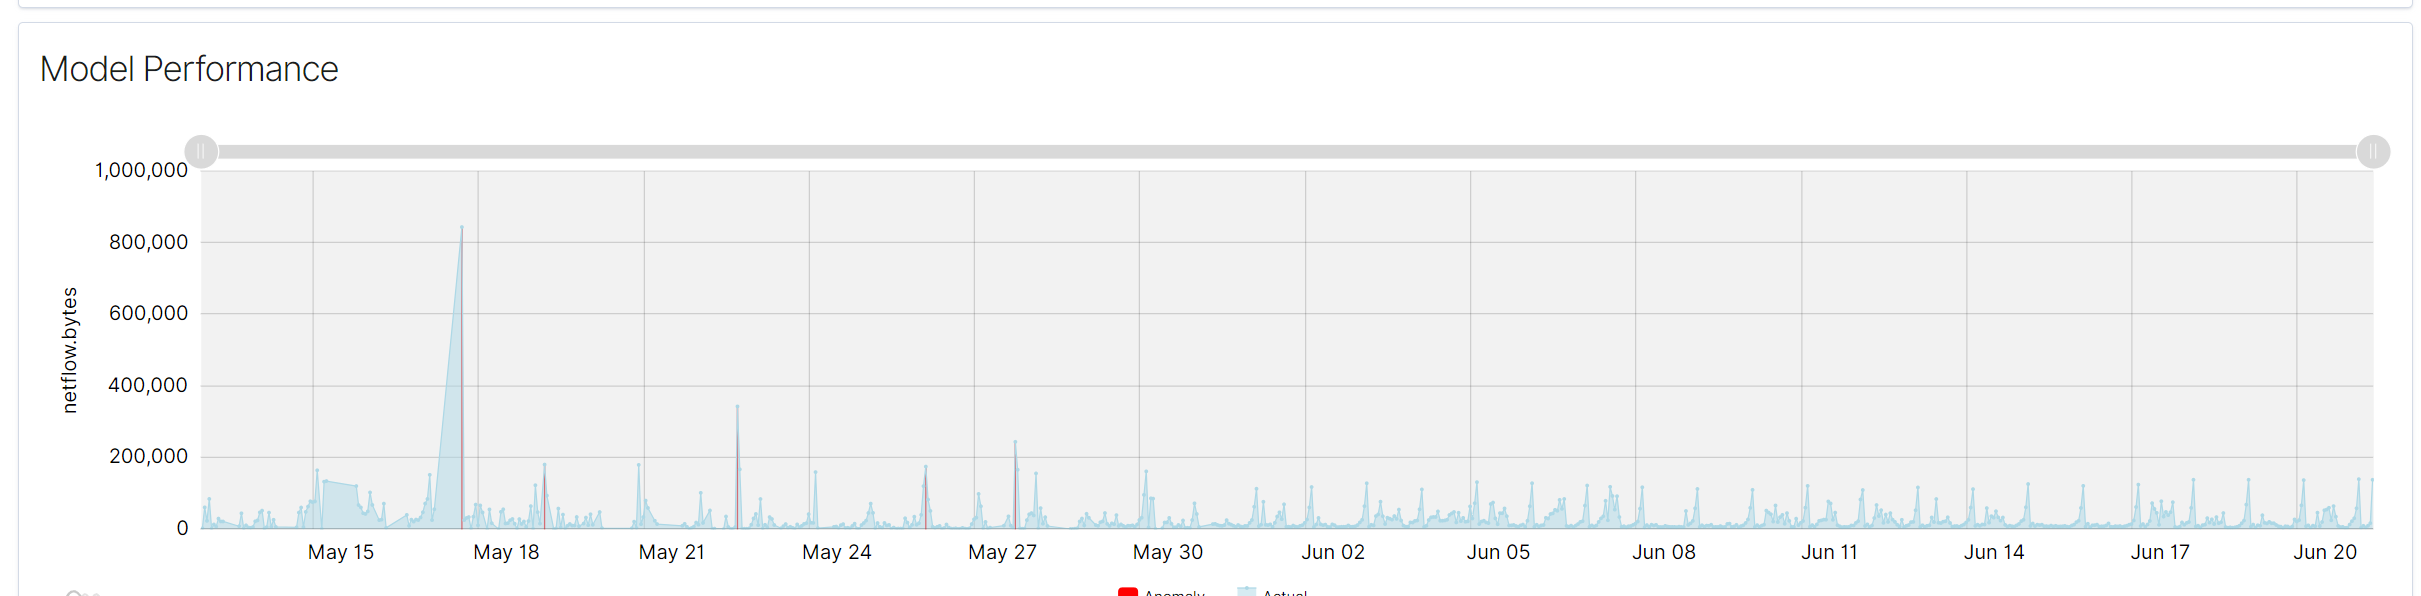
Key Elements of the Performance Graph
Actual Values (Blue Line)
The blue line represents the actual values of the monitored data over time. This line helps in visualizing the normal behavior of the data and identifying patterns or trends.
Anomalies (Red Markers)
Red markers indicate the points where anomalies have been detected. These markers are overlaid on the blue line, showing the specific times when the data deviated from the normal pattern.
Interpreting the Graph
Spikes and Drops: Significant spikes or drops in the blue line could indicate unusual activity or anomalies in the data. Red markers on these spikes or drops confirm the detection of anomalies by the model.
Consistency: Consistent patterns in the blue line without red markers suggest stable data behavior with no detected anomalies.
Using the Performance Graph
Monitoring Trends: The graph allows you to monitor trends and identify periods of abnormal activity.
Investigating Anomalies: By examining the red markers, you can investigate the corresponding timestamps to understand the context of the anomalies.
Adjusting Parameters: If too many or too few anomalies are detected, consider adjusting the contamination factor or other model parameters to improve detection accuracy.
Summary
The performance graph in the Performance Tab of the Univariate Anomaly Detection use case provides a clear visual representation of data behavior and detected anomalies over time. By understanding and utilizing this graph, users can effectively monitor and investigate anomalies, ensuring better data analysis and system optimization.
Multivariate Anomaly Detection
Multivariate Anomaly Detection identifies anomalies across multiple data columns. Below is a guide on configuring this use case.
Step 1: Configuring the Multivariate Anomaly Detection Rule
Choose Between Analyzing Single and Multiple Signals
Multi Values: Ensure the toggle for analyzing multiple signals is enabled. This setting defines how the data is ingested. Single value analysis operates on the numeric aggregation of a selected field, while multi-value analysis uses raw data. Field selection in the former is defined by saved search columns.

Contamination Factor: This setting defines the approximate percentage of data that is considered anomalous.The suggested value lower than 5%.
Complete the configuration of other settings, such as Start Date, Build Time Frame, Scheduler options, and Field to Analyse. These settings are the same as those described in the common configuration guide.
Step 2: Running the Rule
After configuring all settings, click Save to save the rule, then click Run to start the anomaly detection process or Save & Run to start process imidietly.
Summary
Configuring multivariate anomaly detection in the Empowered AI module involves setting the contamination factor and ensuring the analysis mode is set to multi-values.
Performance Tab for Multivariate Anomaly Detection
The Performance Tab provides comprehensive visualizations and detailed information on detected anomalies over time.
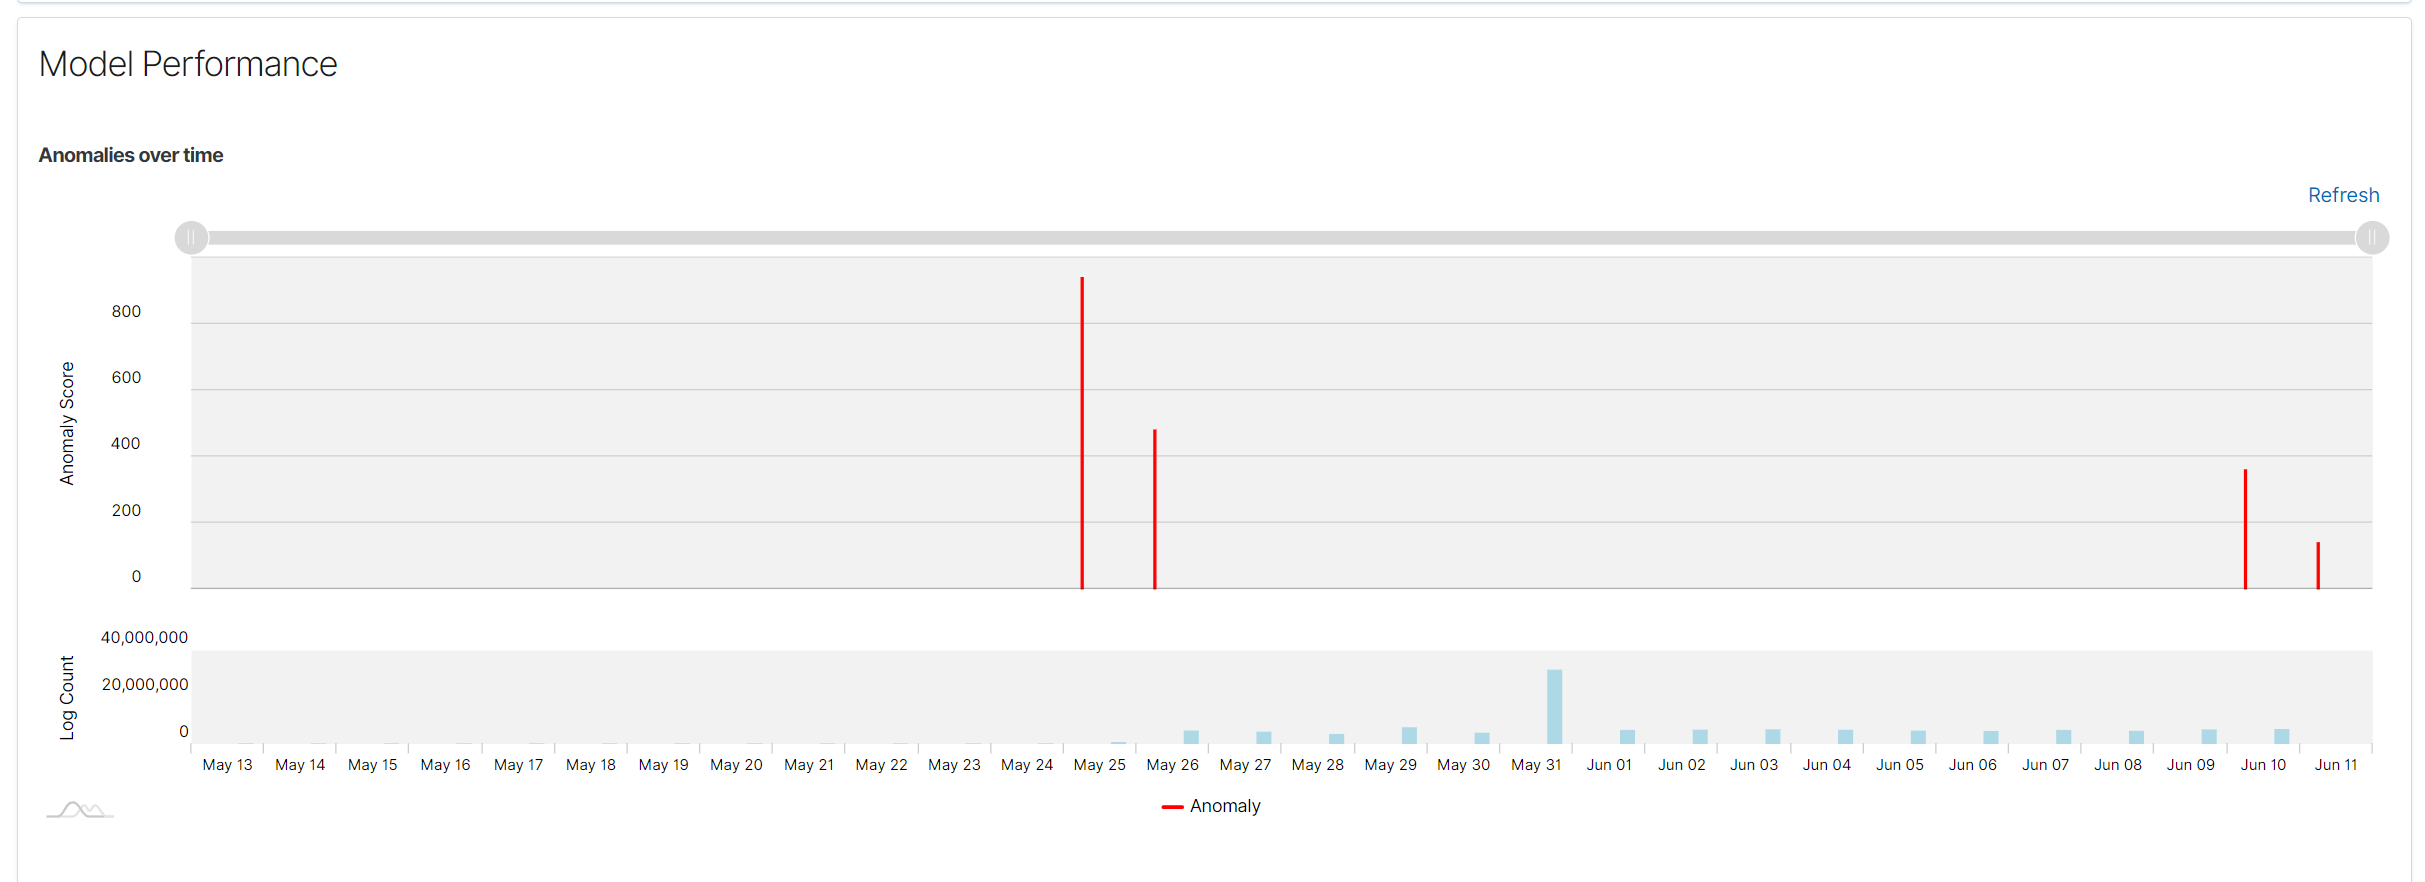
Visualizing Anomalies Over Time
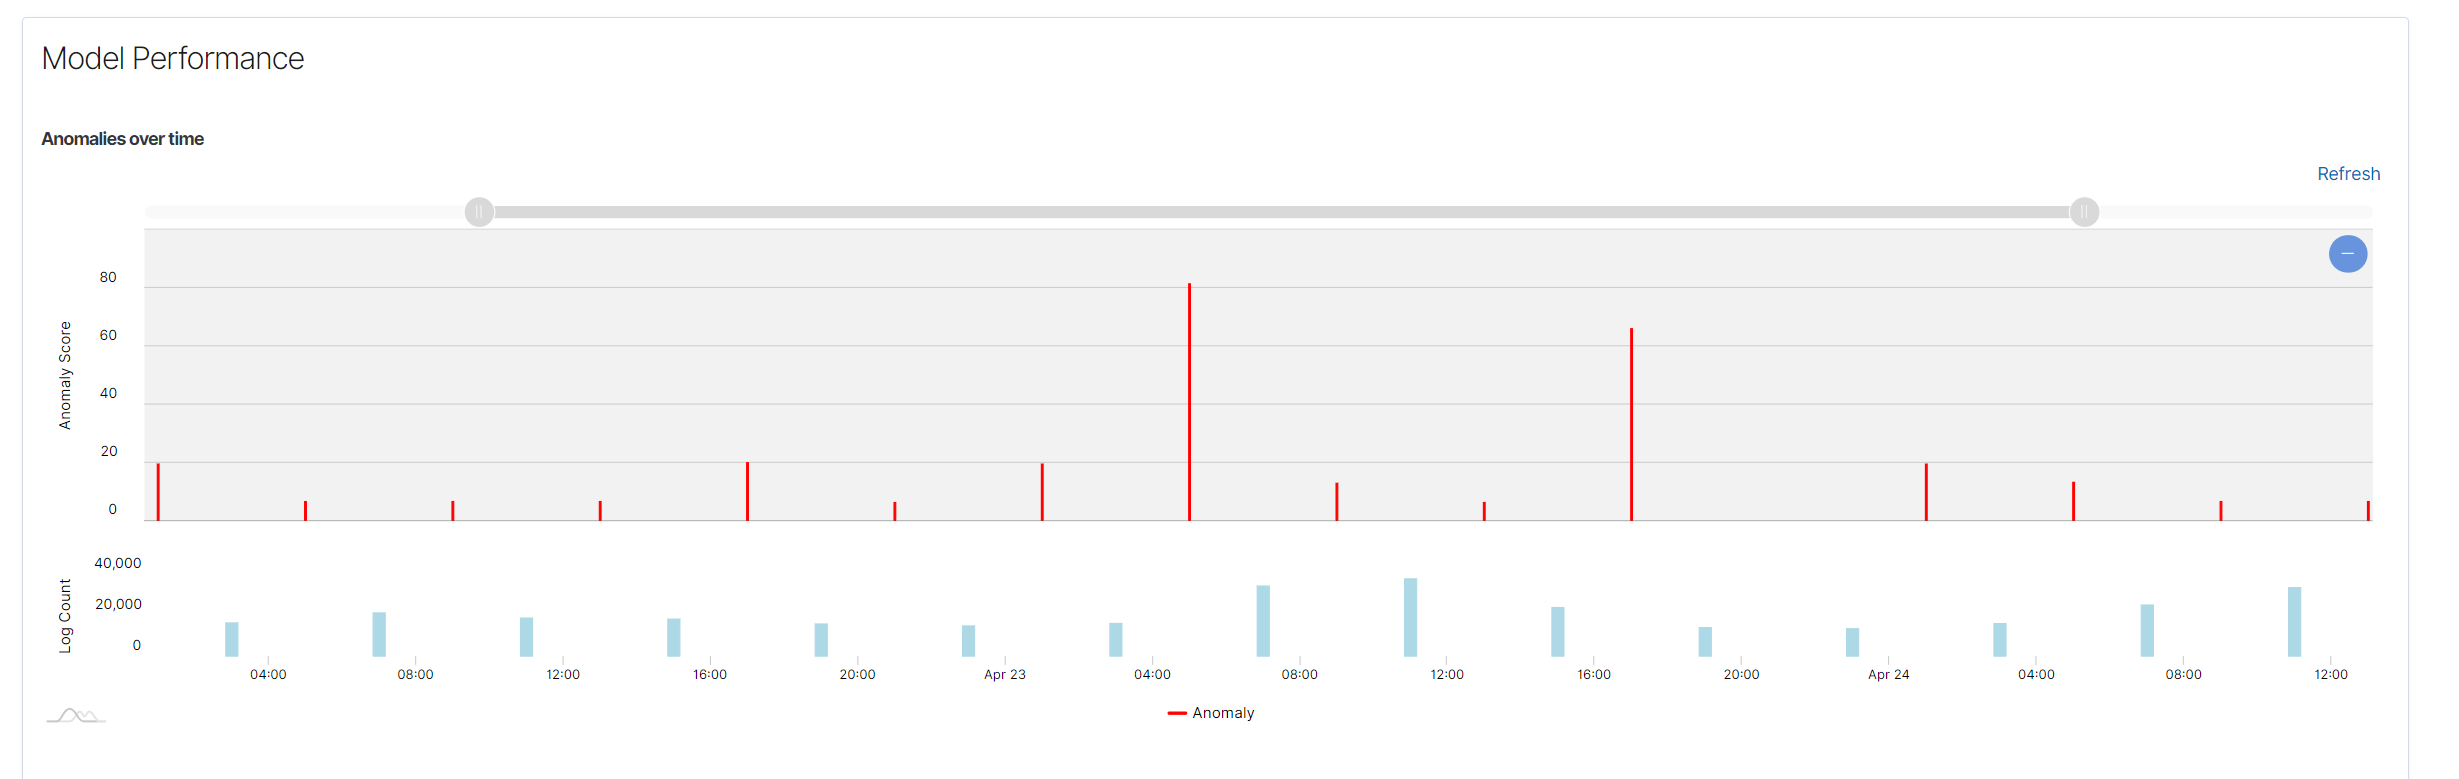
Anomalies Over Time Chart: Displays detected anomalies over time. The X-axis represents time, while the Y-axis represents the anomaly score. Each red vertical line indicates an anomaly detected by the model at a specific time. This visualization helps in identifying periods of high anomaly activity.
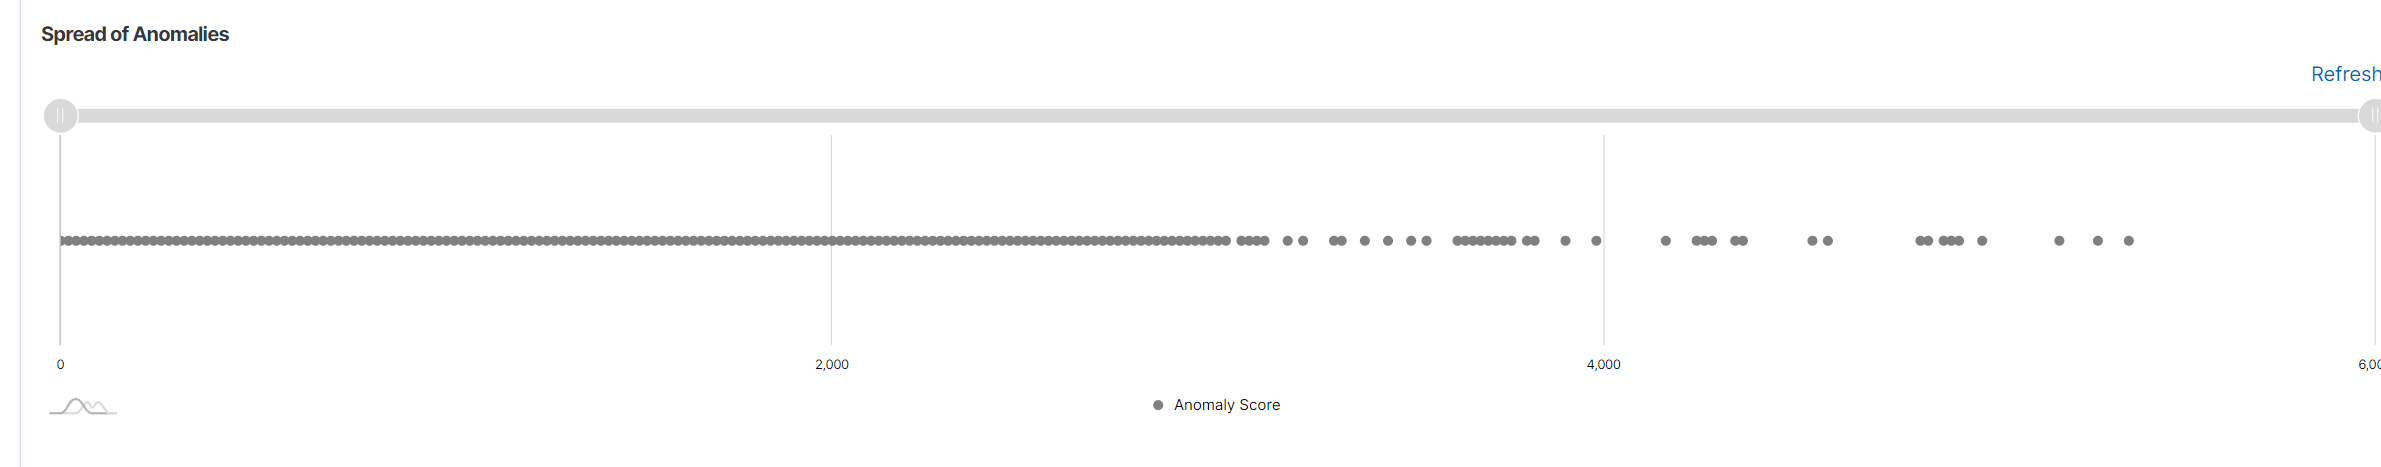
Spread of Anomalies Chart: Shows the distribution of anomaly scores across the entire dataset. Each dot represents an anomaly score, and this chart helps to understand the spread and severity of anomalies in the data.
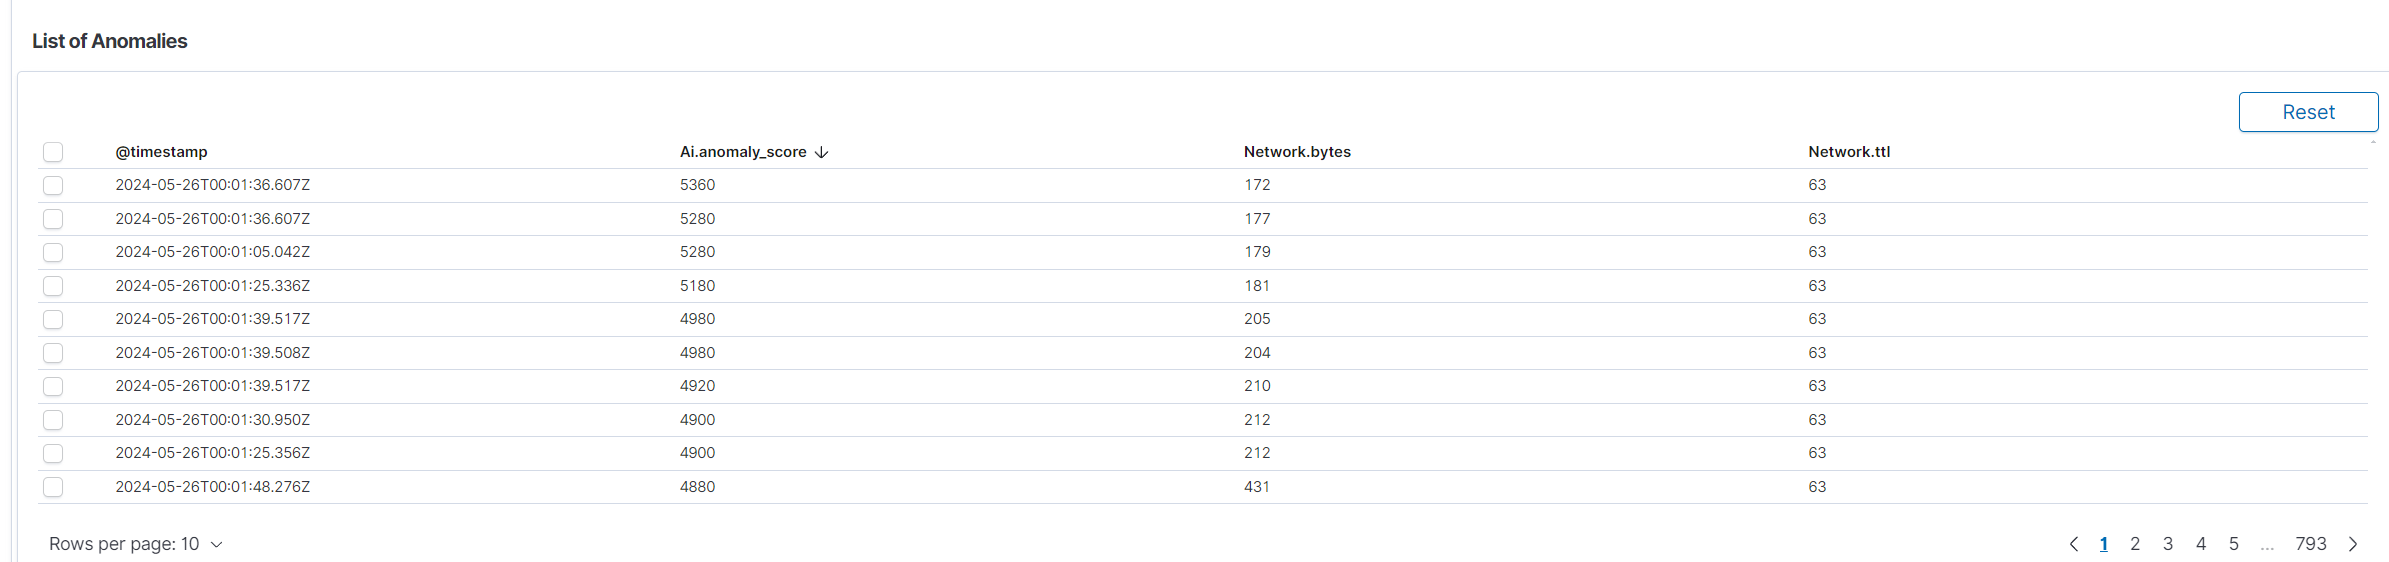
List of Anomalies: Below the charts is a detailed table listing the detected anomalies. The table includes the following columns:
Time: Timestamp of the detected anomaly.
Anomaly Score: Score indicating the severity of the anomaly.
Network.bytes: Specific field from the data that might have contributed to the anomaly.
Source: Additional context or source information about the anomaly.
This table allows users to review anomaly details and gain insights into specific instances of unusual behavior.
Summary
The performance tab for multivariate anomaly detection in the Empowered AI module provides critical information about anomalies detected by the model. Various charts and tables allow users to visualize anomalies over time, understand their distribution, and review detailed information about each detected anomaly. Correct interpretation of these visualizations is crucial for effectively leveraging anomaly detection capabilities.