Agents
Agents module
Before use ensure that you have all the required files
Tool for generating the necessary certificates:
/usr/share/logserver/utils/tlstool/tlstool.sh;Network Probe utilities:
  ./integrations/masteragent/conf.d/masteragent {01-input-agents.conf, 050-filter-agents.conf, 100-output-agents.conf}
  ./integrations/masteragent/masteragent.yml.off.
Linux Agent files:
./agents/masteragent/agents/linux/masteragent:Executable:
MasterBeatAgent.jarConfiguration File for MasterAgent (server):
MasterBeatAgent.confConfiguration File for Agent (client):
agent.confService file:
masteragent.service
Preparations
EVERY COMMAND HAS TO BE EXECUTED FROM /INSTALL DIRECTORY.
Generate the certificates using
tlstools.shscript from/usr/share/logserver/utils/tlstool/.Update the IP of the node directive, by replacing
<Network Probe ip address> with the Network Probe server ip in the provided masteragent.yml config (/usr/share/logserver/utils/tlstool/config/masteragent.yml).Generate certs using masteragent configuration (by default it will be saved to the
out/dir):/usr/share/logserver/utils/tlstool/tlstool.sh -c /usr/share/logserver/utils/tlstool/config/masteragent.yml -ca -crt -t agents/masteragent/certificates
Create KeyStore and TrustStore. Set the KeyStore password of your choice that is utilized to securely store certificates:
cd agents/masteragent/certificates
keytool -import -file rootCA.crt -alias root -keystore root.jks -storetype jks
openssl pkcs12 -export -in localhost.crt -inkey localhost.key -out node_name.p12 -name localhost -certfile rootCA.crt
cd -
Set the KeyStore password of your choice that is utilized to securely store certificates.
Type ‘yes’ when “Trust this certificate?” prompt will be shown.
Set the TrustStore password of your choice that is used to secure CAs. Remember entered passwords - they’ll be used later!
Configure firewall to enable communication on used ports (defaults: TCP 8080 -> Network Probe, TCP 8081 -> agent’s server).
These ports can be changed but must reflect “port” and “Network Probe” directives from an agent.conf file to ensure a connection with the agent.
Commands for default ports:
firewall-cmd --permanent --zone public --add-port 8080/tcp
firewall-cmd --permanent --zone public --add-port 8081/tcp
Configure Network Probe:
Copy files:
cp -rf ./integrations/masteragent/conf.d/* /etc/logserver-probe/conf.d/
Copy pipeline configuration:
cp -rf ./integrations/masteragent/*.yml.off /etc/logserver-probe/pipelines.d/masteragent.yml
cat ./integrations/masteragent/masteragent.yml.off >> /etc/logserver-probe/pipelines.yml
Configure SSL connection, by copying previously generated certificates:
mkdir -p /etc/logserver-probe/conf.d/masteragent/ssl
/bin/cp -rf ./agents/masteragent/certificates/localhost.* ./agents/masteragent/certificates/rootCA.crt /etc/logserver-probe/conf.d/masteragent/ssl/
Set permissions:
chown -R logserver-probe:logserver-probe /etc/logserver-probe/conf.d/masteragent
Restart the Network Probe service with systemctl restart command
Installation of MasterAgent - Server Side
Copy executable and config:
mkdir -p /opt/agents
/bin/cp -rf ./agents/masteragent/agents/linux/masteragent/MasterBeatAgent.jar /opt/agents
/bin/cp -rf ./agents/masteragent/agents/linux/masteragent/MasterBeatAgent.conf /opt/agents/agent.conf
Copy certificates:
/bin/cp -rf ./agents/masteragent/certificates/node_name.p12 ./agents/masteragent/certificates/root.jks /opt/agents/
Set permissions:
chown -R logserver-probe:logserver-probe /opt/agents
Update the configuration file with KeyStore/TrustStore paths and passwords. Use your preferred editor eg. vim:
vim /opt/agents/agent.conf
Installation of Agent - Client Side
Linux
FOR WINDOWS AND LINUX: Client requires at least Java 11+.
Linux Agent - software installed on clients running on Linux OS:
Install net-tools package to use Agent on Linux RH / Centos:
yum install net-tools
Copy executable and config:
mkdir -p /opt/masteragent
/bin/cp -rf ./agents/masteragent/agents/linux/masteragent/agent.conf ./agents/masteragent/agents/linux/masteragent/MasterBeatAgent.jar /opt/masteragent
/bin/cp -rf ./agents/masteragent/agents/linux/masteragent/masteragent.service /usr/lib/systemd/system/masteragent.service
Copy certificates:
/bin/cp -rf ./certificates/node_name.p12 ./certificates/root.jks /opt/masteragent/
Update the configuration file with KeyStore/TrustStore paths and passwords. Also, update the IP and port (by default 8080 is used) of the Network Probe host that the agent will connect to with the ‘Network Probe’ directive. Use your preferred editor eg. vim:
vim /opt/masteragent/agent.confEnable masteragent service:
systemctl daemon-reload
systemctl enable masteragent
systemctl start masteragent
Finally, verify in the Logserver GUI ‘Agents’ plugin if a newly added agent is present. Check masteragent logs executing:
journalctl -fu masteragent
Windows
FOR WINDOWS AND LINUX: Client requires at least Java 11+.
Ensure that you have all required files (
./install/agents/masteragent/agents/windows/masteragent):Installer and manifest:
agents.exe,agents.xmlClient:
Agents.jarConfiguration File:
agent.conf
Configure firewall:
Add an exception to the firewall to listen on TCP port 8081.
Add an exception to the firewall to allow outgoing connection to TCP port masteragent:8080 (reasonable only with configured “http_enabled = true”)Create
C:\Program Files\MasterAgentdirectory.Copy the contents of the
./install/agents/masteragent/agents/windows/masteragentdirectory to theC:\Program Files\MasterAgent.Copy node_name.p12 and root.jks files from the
./install/agents/masteragent/certificatesto desired directory.Update the
C:\Program Files\MasterAgent\agent.conffile with KeyStore/TrustStore paths from the previous step and passwords. Also, update the IP and port (by default 8080 is used) of the Network Probe host that the agent will connect to with the ‘Network Probe’ directive.Start PowerShell as an administrator:
To install an agent you can use interchangeably the following methods:
Method 1 - use installer:
cd "C:\Program Files\MasterAgent"
.\agents.exe install
.\agents.exe start
Method 2 - manually creating service:
New-Service -name masteragent -displayName masteragent -binaryPathName "C:\Program Files\MasterAgent\agents.exe"
Finally, verify in the Logserver GUI ‘
Agents’ plugin if a newly added agent is present. To check out logs and errors, look for ‘agents.out.log’ and ‘agents.err.log’ files in theC:\Program Files\MasterAgentdirectory after the service starts. Also, check the service status:.\agents.exe status
Beats - configuration templates
Go to the
Agentswhich is located in the main menu. Then go toTemplatesand click theAdd templatebutton.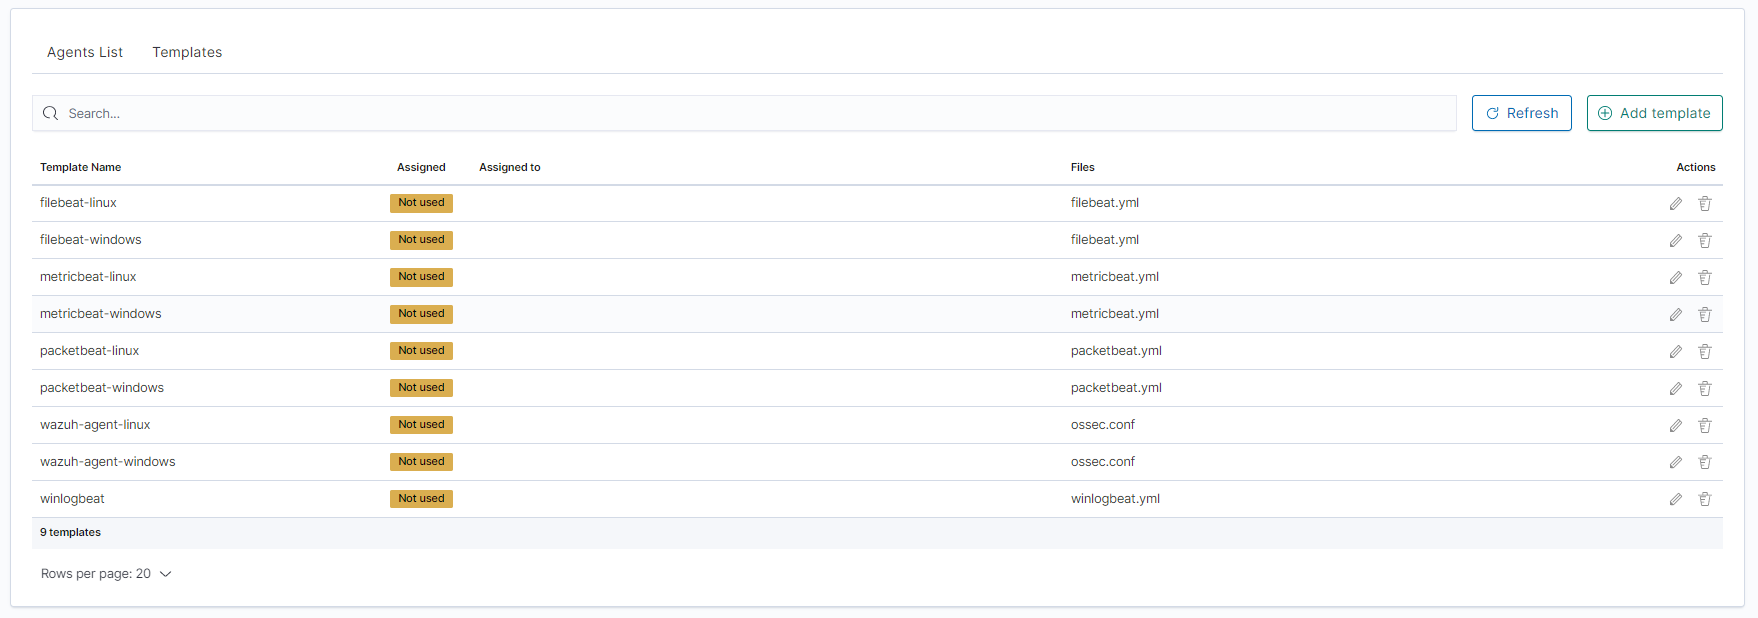
Click the
Create newfile button at the bottom.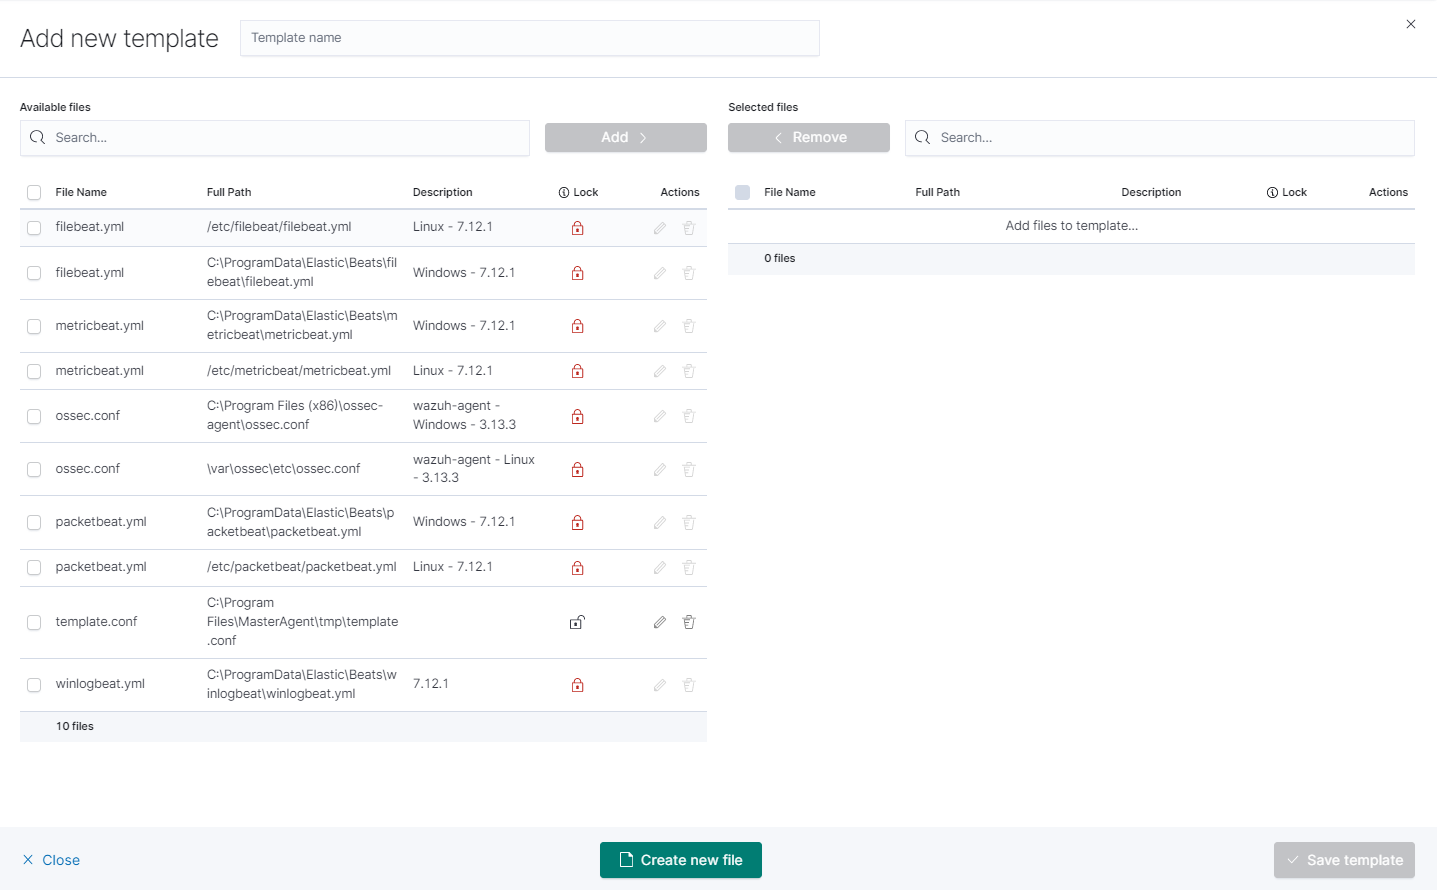
you will see the form to create a file that will be on a client system.
There are inputs such as:Destination Path,
File name,
Description,
Upload file,
Content.
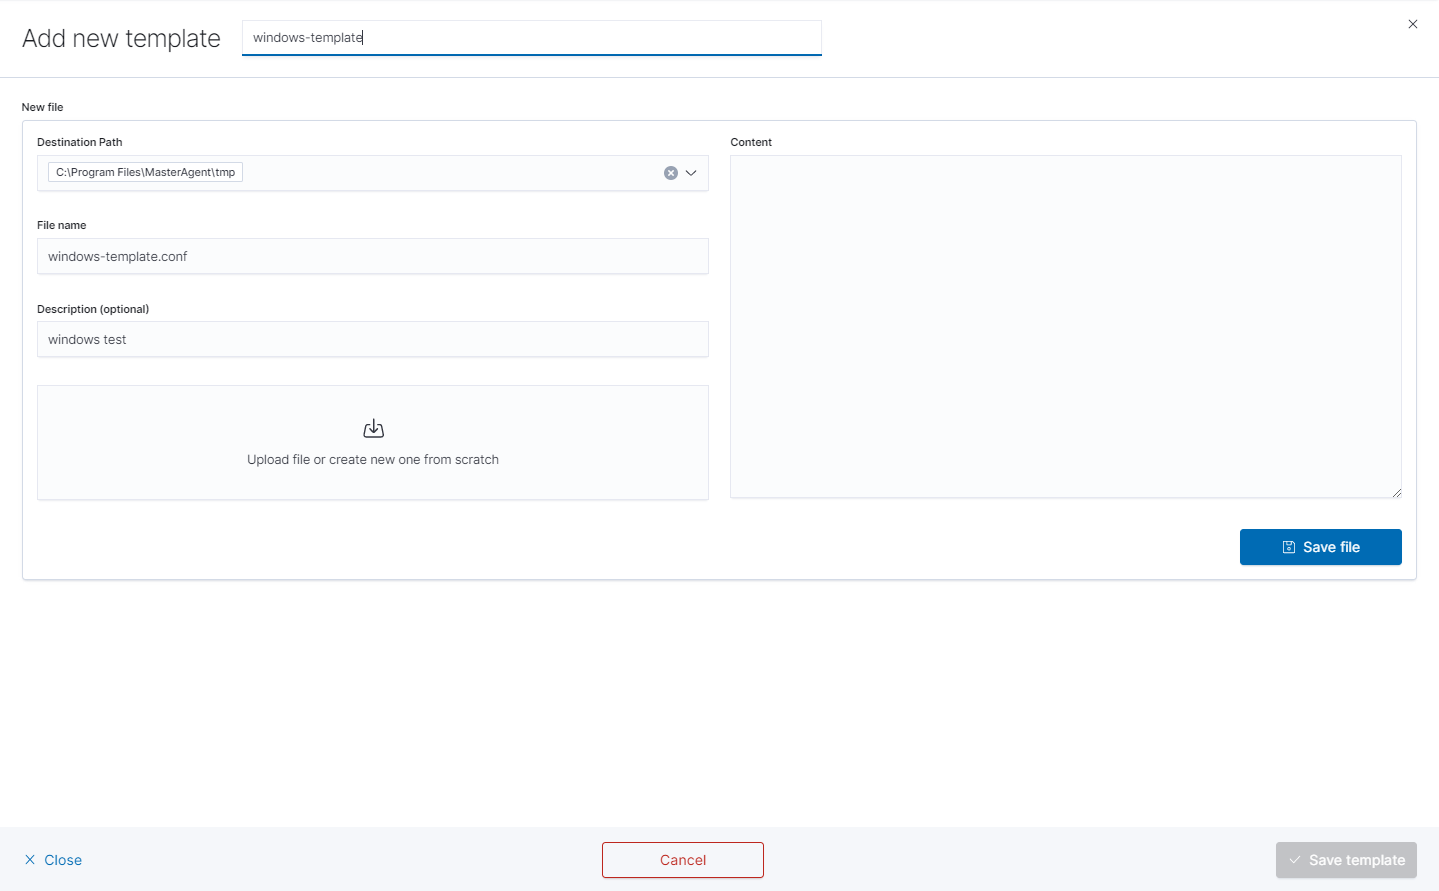
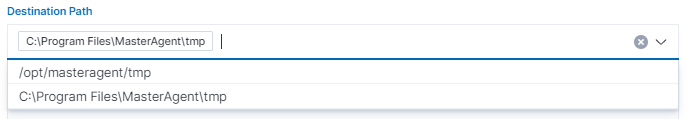
Remember that you must provide the exact path to your directory in the Destination Path field
After that add your file to the template by checking it from the
Available fileslist and clickingAddand thenCreate new file.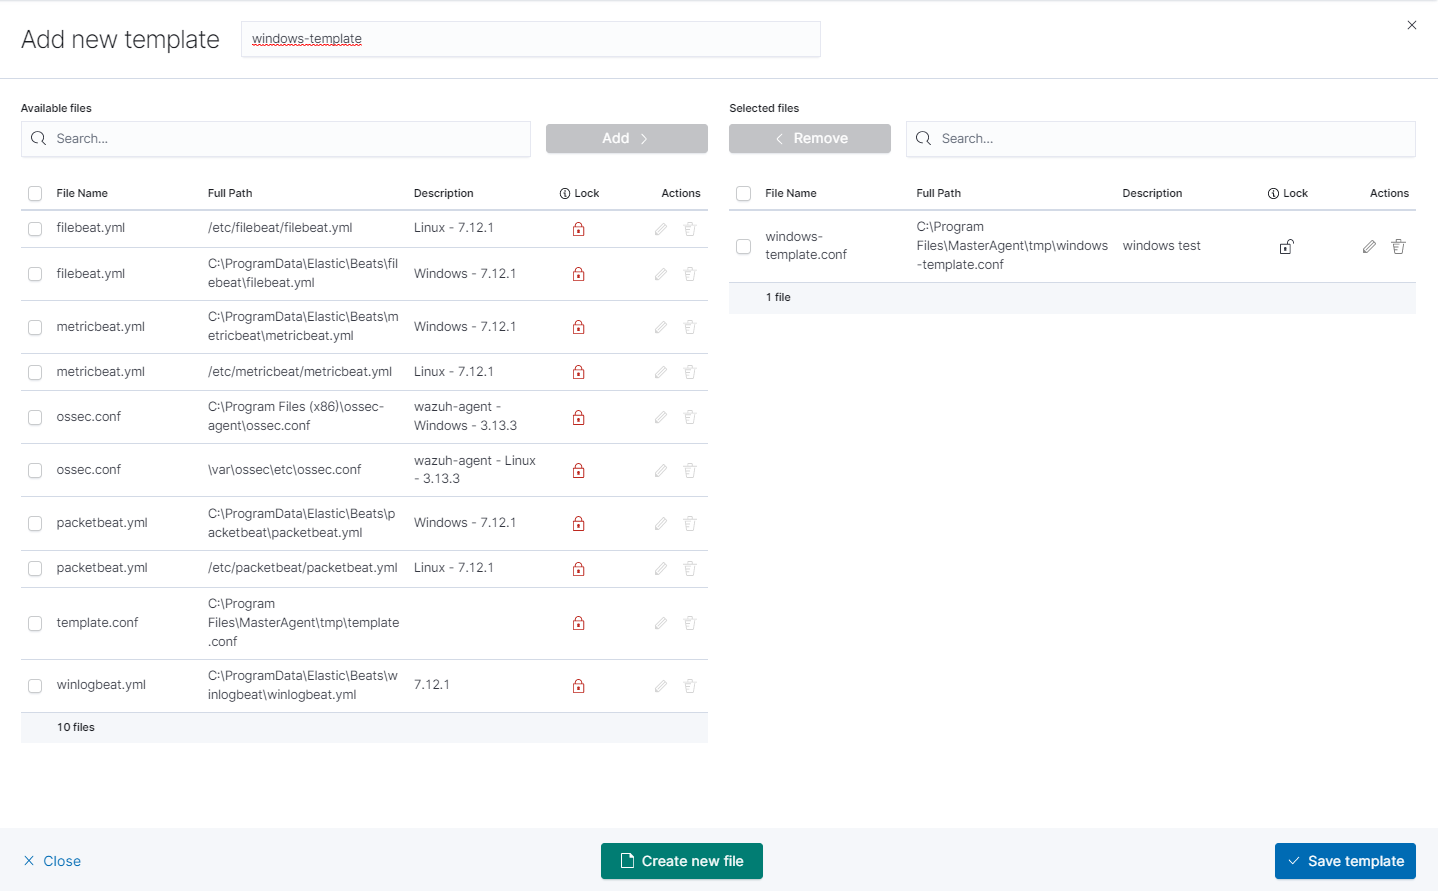
You can now see your template in the
Templatetab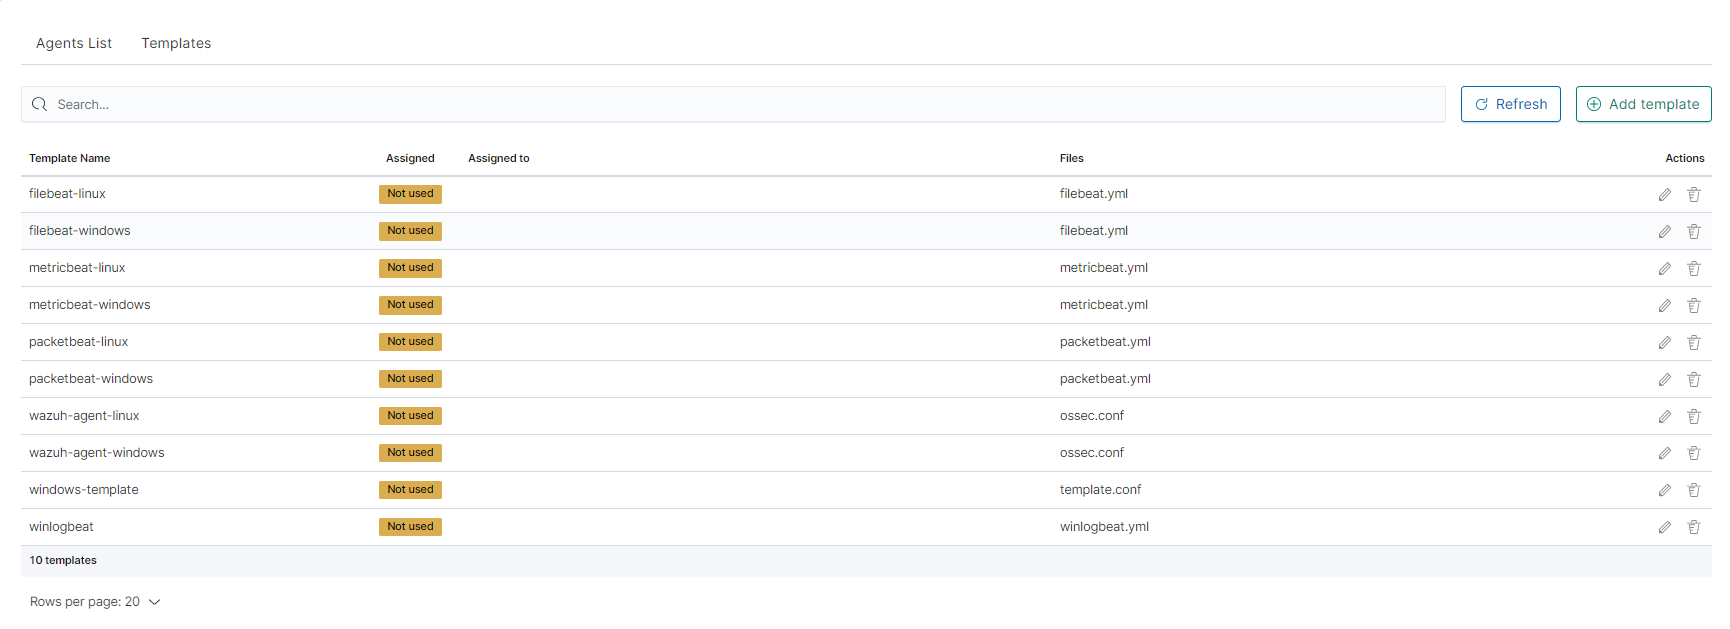
The next step will be to add the template to the agent by checking the agent’s form list and clicking
Apply Template.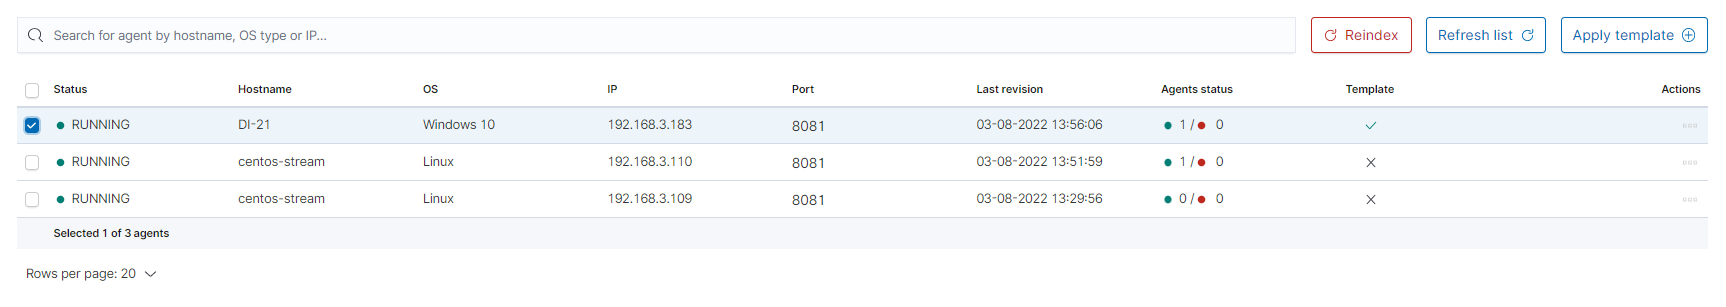
The last step is to apply the template by checking it from the list and clicking the
Applybutton.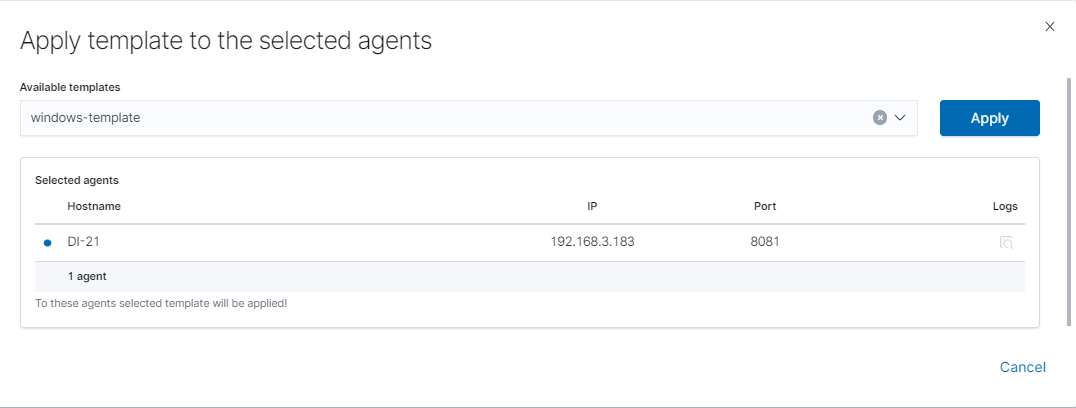
You can also select multiple agents. Remember, if your file path is Windows type You can only select Windows agents. You can check the Logs by clicking the icon in the
logscolumn.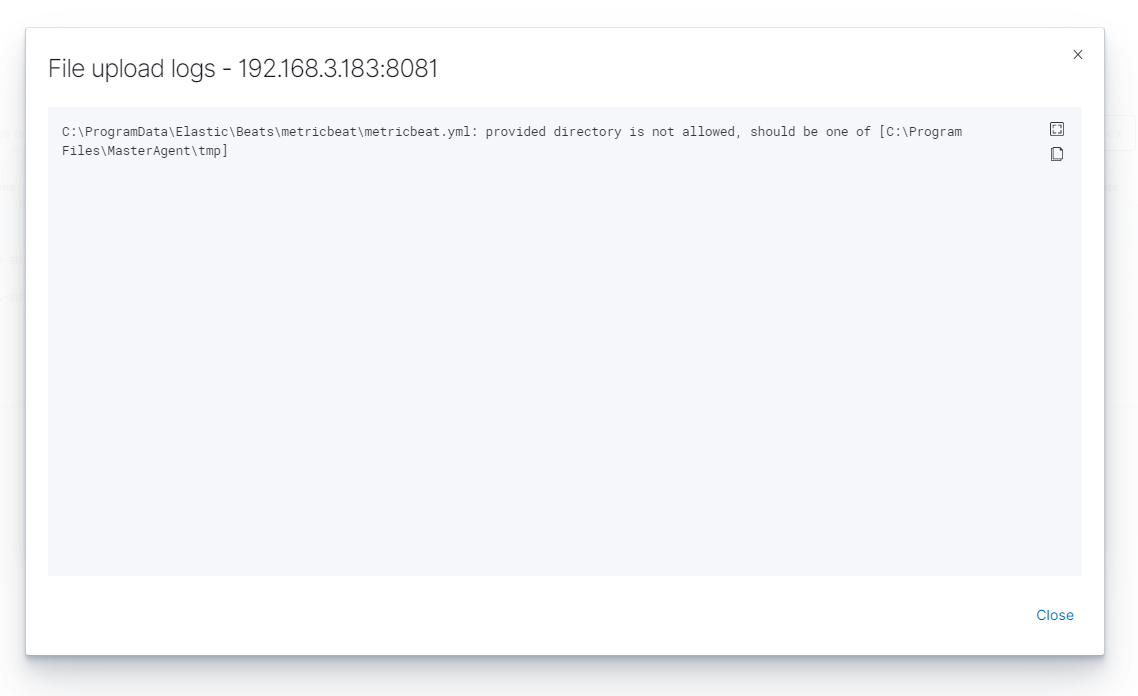
Agent module compatibility
The Agents module among others is compatible with Beats agents in the following versions:
| No | Agent Name | Beats Version |
|---|---|---|
1 |
Filebeat |
OSS 7.17.8 |
2 |
Packetbeat |
OSS 7.17.8 |
3 |
Winlogbeat |
OSS 7.17.8 |
4 |
Metricbeat |
OSS 7.17.8 |
5 |
Heartbeat |
OSS 7.17.8 |
6 |
Auditbeat |
OSS 7.17.8 |
7 |
Windows - Beats agents installation
Winlogbeat
Installation
Copy the Winlogbeat installer from the installation directory
install/Agents/beats/windows/winlogbeat-oss-7.17.8-windows-x86_64.zipand unpackCopy the installation files to the
C:\Program Files\Winlogbeatdirectory
Configuration
Editing the file: C:\Program Files\Winlogbeat\winlogbeat.yml:
In section:
winlogbeat.event_logs:
  - name: Application
    ignore_older: 72h
  - name: Security
  - name: System
change to:
winlogbeat.event_logs:
  - name: Application
    ignore_older: 72h
  - name: Security
    ignore_older: 72h
  - name: System
    ignore_older: 72h
In section:
setup.template.settings:
  index.number_of_shards: 1
change to:
#setup.template.settings:
  #index.number_of_shards: 1
In section:
setup.kibana:
change to:
#setup.kibana:In section:
output.elasticsearch:
  # Array of hosts to connect to.
  hosts: ["localhost:9200"]
change to:
#output.elasticsearch:
  # Array of hosts to connect to.
  #hosts: ["localhost:9200"]
In section:
#output.logstash:
  # The Logserver-Probe hosts
  #hosts: ["localhost:5044"]
change to:
output.logstash:
  # The Logserver-Probe hosts
  hosts: ["logserver-probe-ip:5044"]
In section:
#tags: ["service-X", "web-tier"]change to:
tags: ["winlogbeat"]
Run the
PowerShellconsole as Administrator and execute the following commands:cd 'C:\Program Files\Winlogbeat' .\install-service-winlogbeat.ps1 Security warning Run only scripts that you trust. While scripts from the internet can be useful, this script can potentially harm your computer. If you trust this script, use the Unblock-File cmdlet to allow the script to run without this warning message. Do you want to run C:\Program Files\Winlogbeat\install-service-winlogbeat.ps1? [D] Do not run [R] Run once [S] Suspend [?] Help (default is "D"): R
Output:
Status   Name               DisplayName
------   ----               -----------
Stopped    Winlogbeat      Winlogbeat
Start Winlogbeat service:
sc start Winlogbeat
Test configuration:
cd 'C:\Program Files\Winlogbeat'
winlogbeat.exe test config
winlogbeat.exe test output
Drop event
We can also drop events on the agent side. To do this we need to use the drop_event processor
processors:
  - drop_event:
      when:
        condition
Each condition receives a field to compare. You can specify multiple fields under the same condition by using AND between the fields (for example, field1 AND field2).
For each field, you can specify a simple field name or a nested map, for example, dns.question.name.
See Exported Fields for a list of all the fields that are exported by Winlogbeat.
The supported conditions are:
equals
contains
regexp
range
network
has_fields
or
and
not
equals
With the equals condition, you can compare if a field has a certain value. The condition accepts only an integer or a string value.
For example, the following condition checks if the response code of the HTTP transaction is 200:
equals:
  http.response.code: 200
contains
The contains condition checks if a value is part of a field. The field can be a string or an array of strings. The condition accepts only a string value.
For example, the following condition checks if an error is part of the transaction status:
contains:
  status: "Specific error"
regexp
The regexp condition checks the field against a regular expression. The condition accepts only strings.
For example, the following condition checks if the process name starts with foo:
regexp:
  system.process.name: "^foo.*"
range
The range condition checks if the field is in a certain range of values. The condition supports lt, lte, gt, and gte. The condition accepts only integer or float values.
For example, the following condition checks for failed HTTP transactions by comparing the http.response.code field with 400.
range:
  http.response.code:
    gte: 400
This can also be written as:
range:
  http.response.code.gte: 400
The following condition checks if the CPU usage in percentage has a value between 0.5 and 0.8.
range:
  system.cpu.user.pct.gte: 0.5
  system.cpu.user.pct.lt: 0.8
network
The network condition checks if the field is in a certain IP network range. Both IPv4 and IPv6 addresses are supported. The network range may be specified using CIDR notation, like “192.0.2.0/24” or “2001:db8::/32”, or by using one of these named ranges:
loopback- Matches loopback addresses in the range of 127.0.0.0/8 or ::1/128.unicast- Matches global unicast addresses defined in RFC 1122, RFC 4632, and RFC 4291 with the exception of the IPv4 broadcast address (255.255.255.255). This includes private address ranges.multicast- Matches multicast addresses.interface_local_multicast- Matches IPv6 interface-local multicast addresses.link_local_unicast- Matches link-local unicast addresses.link_local_multicast- Matches link-local multicast addresses.private- Matches private address ranges defined in RFC 1918 (IPv4) and RFC 4193 (IPv6).public- Matches addresses that are not loopback, unspecified, IPv4 broadcast, link-local unicast, link-local multicast, interface local multicast, or private.unspecified- Matches unspecified addresses (either the IPv4 address “0.0.0.0” or the IPv6 address “::”).
The following condition returns true if the source.ip value is within the private address space.
network:
  source.ip: private
This condition returns true if the destination.ip value is within the IPv4 range of 192.168.1.0 - 192.168.1.255.
network:
  destination.ip: '192.168.1.0/24'
This condition returns true when destination.ip is within any of the given subnets.
network:
  destination.ip: ['192.168.1.0/24', '10.0.0.0/8', loopback]
has_fields
The has_fields condition checks if all the given fields exist in the event. The condition accepts a list of string values denoting the field names.
For example, the following condition checks if the http.response.code field is present in the event.
has_fields: ['http.response.code']
or
The or operator receives a list of conditions.
or:
  - <condition1>
  - <condition2>
  - <condition3>
  ...
For example, to configure the condition http.response.code = 304 OR http.response.code = 404:
or:
  - equals:
      http.response.code: 304
  - equals:
      http.response.code: 404
and
The and operator receives a list of conditions.
and:
  - <condition1>
  - <condition2>
  - <condition3>
  ...
For example, to configure the condition http.response.code = 200 AND status = OK:
or:
  - <condition1>
  - and:
    - <condition2>
    - <condition3>
not
The not operator receives the condition to negate.
not:
  <condition>
For example, to configure the condition NOT status = OK:
not:
  equals:
    status: OK
Internal queue
Winlogbeat uses an internal queue to store events before publishing them. The queue is responsible for buffering and combining events into batches that can be consumed by the outputs. The outputs will use bulk operations to send a batch of events in one transaction.
You can configure the type and behavior of the internal queue by setting options in the queue section of the winlogbeat.yml config file. Only one queue type can be configured.
This sample configuration sets the memory queue to buffer up to 4096 events:
queue.mem:
  events: 4096
Configure the memory queue The memory queue keeps all events in memory.
If no flush interval and no number of events to flush is configured, all events published to this queue will be directly consumed by the outputs. To enforce spooling in the queue, set the flush.min_events and flush.timeout options.
By default flush.min_events is set to 2048 and flush.timeout is set to 1s.
The output’s bulk_max_size setting limits the number of events being processed at once.
The memory queue waits for the output to acknowledge or drop events. If the queue is full, no new events can be inserted into the memory queue. Only after the signal from the output will the queue free up space for more events to be accepted.
This sample configuration forwards events to the output if 512 events are available or the oldest available event has been waiting for 5s in the queue:
queue.mem:
  events: 4096
  flush.min_events: 512
  flush.timeout: 5s
Configuration options
You can specify the following options in the queue.mem section of the winlogbeat.yml config file:
events
Number of events the queue can store.
The default value is 4096 events.
flush.min_events
Minimum number of events required for publishing. If this value is set to 0, the output can start publishing events without additional waiting times. Otherwise, the output has to wait for more events to become available.
The default value is 2048.
flush.timeout
Maximum wait time for flush.min_events to be fulfilled. If set to 0s, events will be immediately available for consumption.
The default value is 1s.
Configure disk queue The disk queue stores pending events on the disk rather than the main memory. This allows Beats to queue a larger number of events than is possible with the memory queue, and to save events when a Beat or device is restarted. This increased reliability comes with a performance tradeoff, as every incoming event must be written and read from the device’s disk. However, for setups where the disk is not the main bottleneck, the disk queue gives a simple and relatively low-overhead way to add a layer of robustness to incoming event data.
The disk queue is expected to replace the file spool in a future release.
To enable the disk queue with default settings, specify a maximum size:
queue.disk:
  max_size: 10GB
The queue will be used up to the specified maximum size on the disk. It will only use as much space as required. For example, if the queue is only storing 1GB of events, then it will only occupy 1GB on disk no matter how high the maximum is. Queue data is deleted from the disk after it has been successfully sent to the output.
Configuration options
You can specify the following options in the queue.disk section of the winlogbeat.yml config file:
path
The path to the directory where the disk queue should store its data files. The directory is created on startup if it doesn’t exist.
The default value is "${path.data}/diskqueue".
max_size (required)
The maximum size the queue should use on disk. Events that exceed this maximum will either pause their input or be discarded, depending on the input’s configuration.
A value of 0 means that no maximum size is enforced, and the queue can grow up to the amount of free space on the disk. This value should be used with caution, as filling a system’s main disk can make it inoperable. It is best to use this setting only with a dedicated data or backup partition that will not interfere with Winlogbeat or the rest of the host system.
The default value is 10GB.
segment_size
Data added to the queue is stored in segment files. Each segment contains some number of events waiting to be sent to the outputs and is deleted when all its events are sent. By default, segment size is limited to 1/10 of the maximum queue size. Using a smaller size means that the queue will use more data files, but they will be deleted more quickly after use. Using a larger size means some data will take longer to delete, but the queue will use fewer auxiliary files. It is usually fine to leave this value unchanged.
The default value is max_size / 10.
read_ahead
The number of events that should be read from disk into memory while waiting for an output to request them. If you find outputs are slowing down because they can’t read as many events at a time, adjusting this setting upward may help, at the cost of higher memory usage.
The default value is 512.
write_ahead
The number of events the queue should accept and store in memory while waiting for them to be written to disk. If you find the queue’s memory use is too high because events are waiting too long to be written to disk, adjusting this setting downward may help, at the cost of reduced event throughput. On the other hand, if inputs are waiting or discarding events because they are being produced faster than the disk can handle, adjusting this setting upward may help, at the cost of higher memory usage.
The default value is 2048.
retry_interval
Some disk errors may block the operation of the queue, for example, a permission error writing to the data directory, or a disk full error while writing an event. In this case, the queue reports the error and retries after pausing for the time specified in retry_interval.
The default value is 1s (one second).
max_retry_interval When multiple consecutive errors are written to the disk, the queue increases the retry interval by factors of 2 up to a maximum of max_retry_interval. Increase this value if you are concerned about logging too many errors or overloading the host system if the target disk becomes unavailable for an extended time.
The default value is 30s (thirty seconds).
Filebeat
Filebeat Installation
Copy the Filebeat installer from the installation directory
install/Agents/beats/windows/filebeat-oss-7.17.8-windows-x86_64.zipand unpackCopy the installation files to the
C:\Program Files\Filebeatdirectory
Configuration
Editing the file: C:\Program Files\Filebeat\filebeat.yml:
In section:
- type: log

  # Change to true to enable this input configuration.
  enabled: false
change to:
- type: log

  # Change to true to enable this input configuration.
  enabled: true
In section:
    paths:
    - /var/log/*.log
    #- c:\programdata\logserver\logs\*
change to:
paths:
    #- /var/log/*.log
    #- c:\programdata\logserver\logs\*
    - "C:\Program Files\Microsoft SQL Server\*\MSSQL\Log\*"
    - "C:\inetpub\logs\*""
In section:
setup.template.settings:
  index.number_of_shards: 1
change to:
#setup.template.settings:
  #index.number_of_shards: 1
In section:
setup.kibana:
change to:
#setup.kibana:In section:
output.elasticsearch:
  # Array of hosts to connect to.
  hosts: ["localhost:9200"]
change to:
#output.elasticsearch:
  # Array of hosts to connect to.
  #hosts: ["localhost:9200"]
In section:
#output.logstash:
  # The Logserver-Probe hosts
  #hosts: ["localhost:5044"]
change to:
output.logstash:
  # The Logserver-Probe hosts
  hosts: ["logserver-probe-ip:5044"]
In section:
#tags: ["service-X", "web-tier"]change to:
tags: ["filebeat"]
Run the
PowerShellconsole as Administrator and execute the following commands:cd 'C:\Program Files\Filebeat' .\install-service-filebeat.ps1 Security warning Run only scripts that you trust. While scripts from the internet can be useful, this script can potentially harm your computer. If you trust this script, use the Unblock-File cmdlet to allow the script to run without this warning message. Do you want to run C:\Program Files\Filebeat\install-service-filebeat.ps1? [D] Do not run [R] Run once [S] Suspend [?] Help (default is "D"): R
Output:
Status   Name               DisplayName
------   ----               -----------
Stopped  Filebeat        Filebeat
Start Filebeat service:
sc start filebeat
You can enable, disable, and list Filebeat modules using the following command:
cd 'C:\Program Files\Filebeat'
filebeat.exe modules list
filebeat.exe modules apache enable
filebeat.exe modules apache disable
Test configuration:
cd 'C:\Program Files\Filebeat'
filebeat.exe test config
filebeat.exe test output
Metricbeat
Metricbeat Installation
Copy the Metricbeat installer from the installation directory
install/Agents/beats/windows/metricbeat-oss-7.17.8-windows-x86_64.zipand unpackCopy the installation files to the
C:\Program Files\Metricbeatdirectory
Configuration
Editing the file: C:\Program Files\Metricbeat\metricbeat.yml:
In section:
setup.template.settings:
  index.number_of_shards: 1
  index.codec: best_compression
change to:
#setup.template.settings:
  #index.number_of_shards: 1
  #index.codec: best_compression
In section:
setup.kibana:
change to:
#setup.kibana:In section:
output.elasticsearch:
  # Array of hosts to connect to.
  hosts: ["localhost:9200"]
change to:
#output.elasticsearch:
  # Array of hosts to connect to.
  #hosts: ["localhost:9200"]
In section:
#output.logstash:
  # The Logserver-Probe hosts
  #hosts: ["localhost:5044"]
change to:
output.logstash:
  # The Logserver-Probe hosts
  hosts: ["logserver-probe-ip:5044"]
In section:
#tags: ["service-X", "web-tier"]change to:
tags: ["metricbeat"]
Run the
PowerShellconsole as Administrator and execute the following commands:cd 'C:\Program Files\Metricbeat' .\install-service-metricbeat.ps1 Security warning Run only scripts that you trust. While scripts from the internet can be useful, this script can potentially harm your computer. If you trust this script, use the Unblock-File cmdlet to allow the script to run without this warning message. Do you want to run C:\Program Files\Metricbeat\install-service-metricbeat.ps1? [D] Do not run [R] Run once [S] Suspend [?] Help (default is "D"): R
Output:
Status   Name               DisplayName
------   ----               -----------
Stopped  Metricbeat        Metricbeat
Start Metricbeat service:
sc start metricbeat
You can enable, disable, and list Metricbeat modules using the following command:
cd 'C:\Program Files\Metricbeat'
metricbeat.exe modules list
metricbeat.exe modules apache enable
metricbeat.exe modules apache disable
Test configuration:
cd 'C:\Program Files\Metricbeat'
metricbeat.exe test config
metricbeat.exe test output
Packetbeat
Packetbeat Installation
Copy the Packetbeat installer from the installation directory
install/Agents/beats/windows/packetbeat-oss-7.17.8-windows-x86_64.zipand unpackCopy the installation files to the
C:\Program Files\Packetbeatdirectory
Configuration
Editing the file: C:\Program Files\Packetbeat\packetbeat.yml:
In section:
setup.template.settings:
  index.number_of_shards: 3
change to:
#setup.template.settings:
  #index.number_of_shards: 3
In section:
setup.kibana:
change to:
#setup.kibana:In section:
output.elasticsearch:
  # Array of hosts to connect to.
  hosts: ["localhost:9200"]
change to:
#output.elasticsearch:
  # Array of hosts to connect to.
  #hosts: ["localhost:9200"]
In section:
#output.logstash:
  # The Logserver-Probe hosts
  #hosts: ["localhost:5044"]
change to:
output.logstash:
  # The Logserver-Probe hosts
  hosts: ["logserver-probe-ip:5044"]
In section:
#tags: ["service-X", "web-tier"]change to:
tags: ["packetbeat"]
Run the
PowerShellconsole as Administrator and execute the following commands:cd 'C:\Program Files\Packetbeat' .\install-service-packetbeat.ps1 Security warning Run only scripts that you trust. While scripts from the internet can be useful, this script can potentially harm your computer. If you trust this script, use the Unblock-File cmdlet to allow the script to run without this warning message. Do you want to run C:\Program Files\Packetbeat\install-service-packetbeat.ps1? [D] Do not run [R] Run once [S] Suspend [?] Help (default is "D"): R
Output:
Status   Name               DisplayName
------   ----               -----------
Stopped  Packetbeat        Packetbeat
Start Packetbeat service:
sc start packetbeat
Test configuration:
cd 'C:\Program Files\Packetbeat'
packetbeat.exe test config
packetbeat.exe test output
Linux - Beats agents installation
Filebeat (Linux)
Filebeat (Linux) Installation
Copy the Filebeat installer from the installation directory
install/Agents/beats/linux/filebeat-oss-7.17.8-x86_64.rpmInstall filebeat with the following command:
yum install -y filebeat-oss-7.17.8-x86_64.rpm
Configuration
Editing the file: /etc/filebeat/filebeat.yml:
In section:
- type: log

  # Change to true to enable this input configuration.
  enabled: false
change to:
- type: log

  # Change to true to enable this input configuration.
  enabled: true
In section:
setup.template.settings:
  index.number_of_shards: 1
change to:
#setup.template.settings:
  #index.number_of_shards: 1
In section:
setup.kibana:
change to:
#setup.kibana:In section:
output.elasticsearch:
  # Array of hosts to connect to.
  hosts: ["localhost:9200"]
change to:
#output.elasticsearch:
  # Array of hosts to connect to.
  #hosts: ["localhost:9200"]
In section:
#output.logstash:
  # The Logserver-Probe hosts
  #hosts: ["localhost:5044"]
change to:
output.logstash:
  # The Logserver-Probe hosts
  hosts: ["logserver-probe-ip:5044"]
In section:
#tags: ["service-X", "web-tier"]change to:
tags: ["filebeat"]
Start Filebeat service:
systemctl start filebeat
You can enable, disable, and list Filebeat modules using the following command:
filebeat modules list
filebeat modules apache enable
filebeat modules apache disable
Test configuration:
filebeat test config
filebeat test output
Metricbeat (Linux)
Metricbeat (Linux) Installation
Copy the Metricbeat installer from the installation directory
install/Agents/beats/linux/metricbeat-oss-7.17.8-x86_64.rpmInstall Metricbeat with the following command:
yum install -y metricbeat-oss-7.17.8-x86_64.rpm
Configuration
Editing the file: /etc/metricbeat/metricbeat.yml:
In section:
setup.template.settings:
  index.number_of_shards: 1
  index.codec: best_compression
change to:
#setup.template.settings:
  #index.number_of_shards: 1
  #index.codec: best_compression
In section:
setup.kibana:
change to:
#setup.kibana:In section:
output.elasticsearch:
  # Array of hosts to connect to.
  hosts: ["localhost:9200"]
change to:
#output.elasticsearch:
  # Array of hosts to connect to.
  #hosts: ["localhost:9200"]
In section:
#output.logstash:
  # The Logserver-Probe hosts
  #hosts: ["localhost:5044"]
change to:
output.logstash:
  # The Logserver-Probe hosts
  hosts: ["logserver-probe-ip:5044"]
In section:
#tags: ["service-X", "web-tier"]change to:
tags: ["metricbeat"]
Start Metricbeat service:
systemctl start metricbeat
You can enable, disable, and list Metricbeat modules using the following command:
metricbeat modules list
metricbeat modules apache enable
metricbeat modules apache disable
Test configuration:
metricbeat test config
metricbeat test output
Packetbeat (Linux)
Packetbeat (Linux) Installation
Copy the Packetbeat installer from the installation directory
install/Agents/beats/linux/packetbeat-oss-7.17.8-x86_64.rpmInstall Packetbeat with the following command:
yum install -y packetbeat-oss-7.17.8-x86_64.rpm
Configuration
Editing the file: /etc/packetbeat/packetbeat.yml:
In section:
setup.template.settings:
  index.number_of_shards: 3
change to:
#setup.template.settings:
  #index.number_of_shards: 3
In section:
setup.kibana:
change to:
#setup.kibana:In section:
output.elasticsearch:
  # Array of hosts to connect to.
  hosts: ["localhost:9200"]
change to:
#output.elasticsearch:
  # Array of hosts to connect to.
  #hosts: ["localhost:9200"]
In section:
#output.logstash:
  # The Logserver-Probe hosts
  #hosts: ["localhost:5044"]
change to:
output.logstash:
  # The Logserver-Probe hosts
  hosts: ["logserver-probe-ip:5044"]
In section:
#tags: ["service-X", "web-tier"]change to:
tags: ["packetbeat"]
Start Packetbeat service:
systemctl start packetbeat
Test configuration:
packetbeat test config
packetbeat test output