Installation Process
This chapter describes the step-by-step procedure for deploying integrations from the Integrations plugin. For the catalog overview, status filters, and the Agents/MasterAgent disambiguation, see Integrations - Overview.
Choosing an Integration
Open Tools → Integrations in the sidebar.
Use the search box, the category filters, or the status filters (
Deployed,Partial,Not Started) to locate the integration.Click the integration card. The wizard page opens with two buttons in the top-right corner: Advanced and One Click.
One Click Installation
The One Click button installs every component of the integration in a single action: Network Probe pipelines, Discover dashboards, alert rules, and (for integrations that ship them) collector binaries.
The wizard page shows the current state of each component group as a checklist. After clicking One Click, every item that is not already installed is deployed, and the indicators update to show the new component counts.
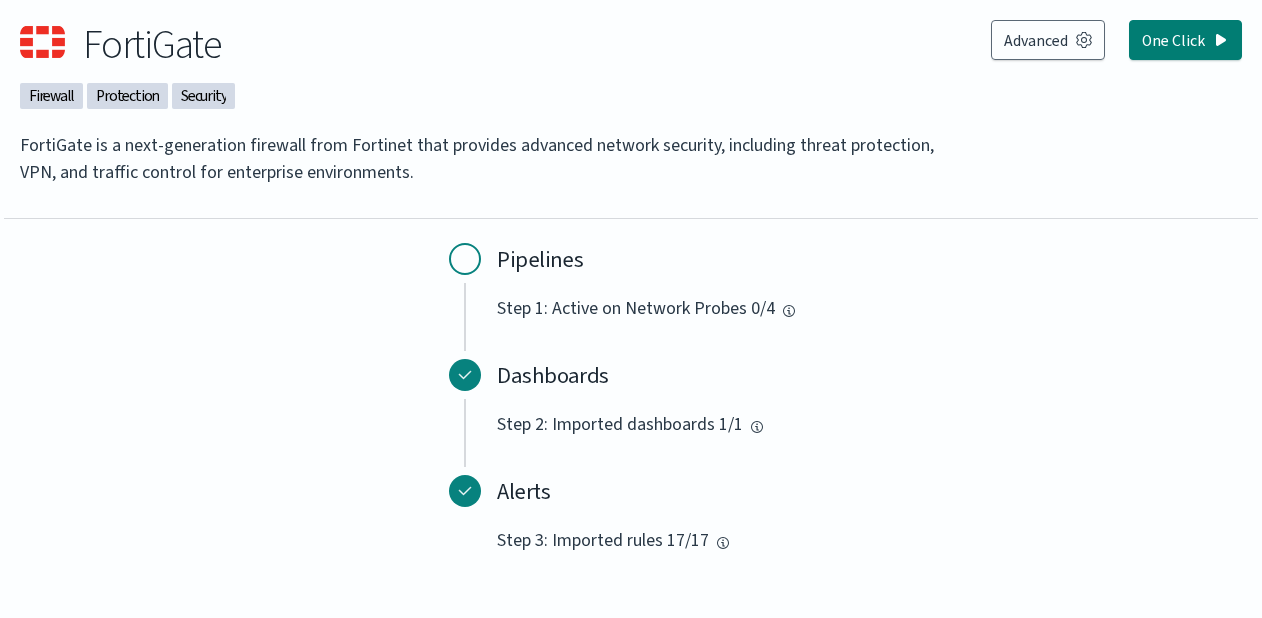
In the example above, the Dashboards (1/1) and Alerts (17/17) are already deployed, and only the Pipelines step (0/4) remains. Clicking One Click would activate the integration’s pipeline on all four Network Probes registered in the cluster.
Advanced Installation
The Advanced button opens a numbered wizard. Each step lets you select the components to install for that group, then choose Install to apply or Skip to move on without installing. Steps that have nothing to install are marked complete automatically.
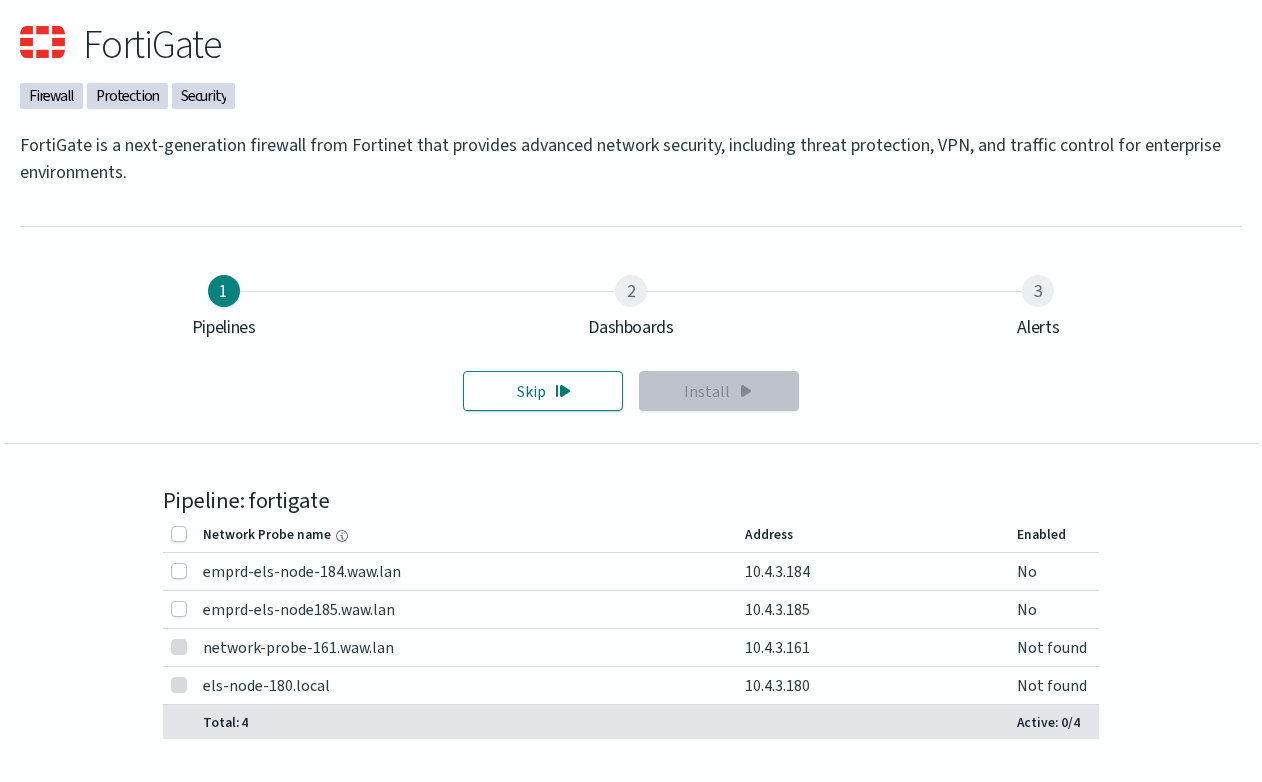
The wizard exposes three steps for most integrations:
Step |
What it installs |
|---|---|
1. Pipelines |
Activates the integration’s Network Probe pipeline on the probes you select. The table lists every Network Probe in the cluster with its address and current activation status ( |
2. Dashboards |
Imports the integration’s Discover dashboards. |
3. Alerts |
Imports the integration’s alert rules. |
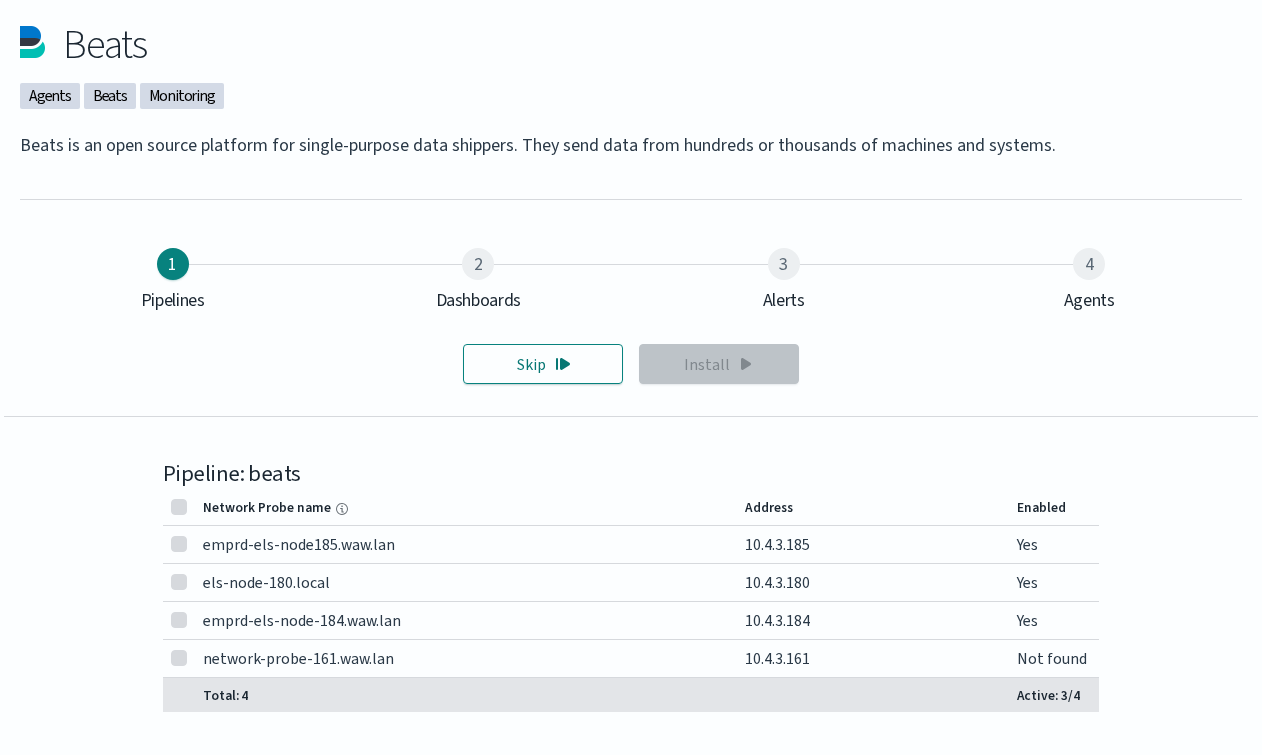
Some integrations expose a fourth step:
Step |
What it installs |
|---|---|
4. Agents |
Lets you download the collector binaries shipped with the integration (for example, Beats agents) together with a configuration file generated for your cluster. The download is delivered to your local machine; the actual installation on the source host is performed manually by the administrator. |
The Agents step is shown only for integrations that bundle a collector. Integrations that ingest data over syslog or by polling a remote API (for example, FortiGate, Tenable Security Center, QualysGuard) have only the three standard steps.
Manual Configuration
A small set of integrations can be deployed without the GUI wizard by editing the Network Probe pipeline files directly. This route fits environments without GUI access and scripted deployments. Tenable.sc and QualysGuard are documented here because they require manual credentials and endpoint configuration that the wizard does not collect.
The procedure for both integrations follows the same shape:
Enable the pipeline in the Network Probe configuration. Edit
/etc/logserver-probe/pipelines.ymland uncomment the relevant block:For Tenable.sc:
- pipeline.id: tenable.sc
  path.config: "/etc/logserver-probe/conf.d/tenable.sc/*.conf"
For QualysGuard:
- pipeline.id: qualys
  path.config: "/etc/logserver-probe/conf.d/qualys/*.conf"
Configure the connection to the scanner manager by editing the integration’s
main.pyfile.For Tenable.sc, edit
/etc/logserver-probe/conf.d/tenable.sc/venv/main.py:TENABLE_ADDR: IP address and port of the Tenable.sc managerTENABLE_CRED: username and passwordNETWORK_PROBE_ADDR: IP address and port of the Network Probe
Example:
TENABLE_ADDR = ('10.4.3.204', 443)
TENABLE_CRED = ('admin', 'password')
NETWORK_PROBE_ADDR = ('127.0.0.1', 10000)
For QualysGuard, edit
/etc/logserver-probe/conf.d/qualys/venv/main.py:NETWORK_PROBE_ADDR: IP address and port of the Network Probehostname: address of the QualysGuard managerusernameandpassword: credentials for the QualysGuard manager
Example:
NETWORK_PROBE_ADDR = ('127.0.0.1', 10001)

conn = qualysapi.connect(
    username="admin",
    password="password",
    hostname="qualysguard.qg2.apps.qualys.eu"
)
Restart the Network Probe service to apply the changes:
systemctl restart logserver-probe
The collected data appears in the integration’s dashboards ([Vulnerability] Overview Tenable for Tenable.sc, [Vulnerability] Overview Qualys for QualysGuard) once the pipeline runs and indexes its first results.